
Long-Term Stock ETFs Compared: VOO, VTI, QQQ and Where Each One Fits in 2026
How to think about VOO, VTI, QQQ and VXUS for long-term investing: fees, concentration, drawdown history and how the funds overlap, with 2026 data.
Reference information only. This article is not investment advice, a recommendation, or a solicitation to buy or sell any security. Stock ETFs can lose money, sometimes sharply and for years. Figures may already be out of date. Check each fund's prospectus and consider your own situation before acting.
Why long-term investors start with broad stock ETFs
Most long-term portfolios are built on a short list of low-cost stock ETFs, and the reasoning is mostly arithmetic. A broad fund owns hundreds or thousands of companies, charges very little, and never has to be right about which stock wins.
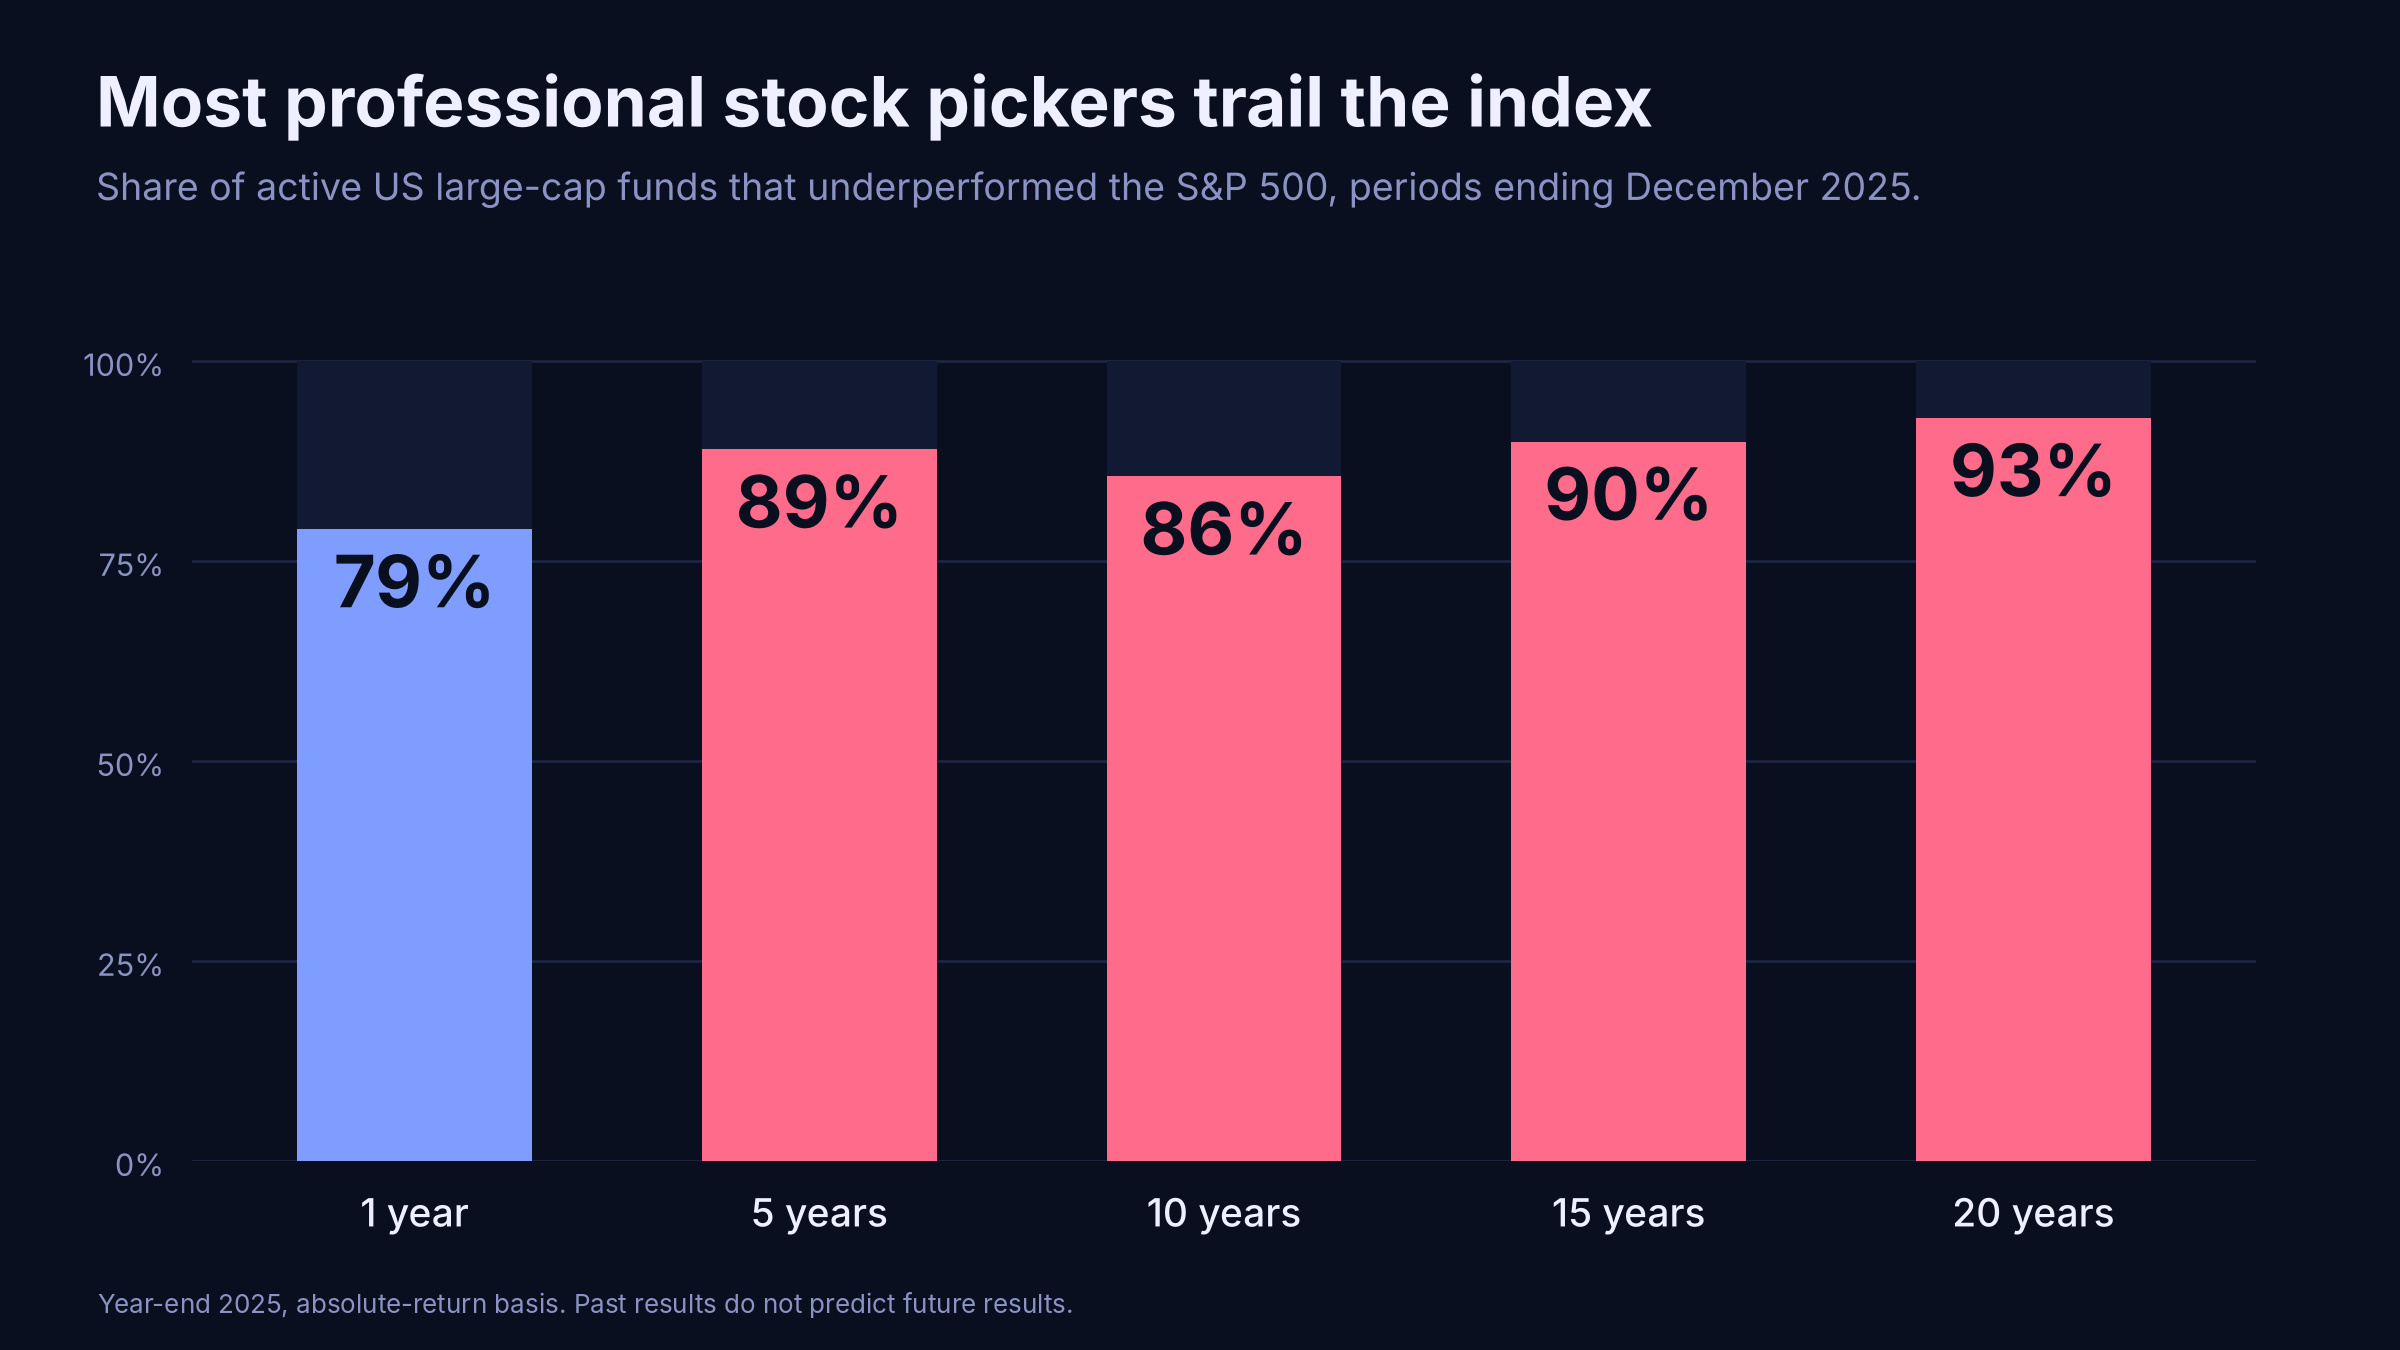
The evidence for skipping stock-picking is unusually consistent. In 2025, 79% of active US large-cap funds underperformed the S&P 500. Over 15 years, 89.93% did, and over 20 years, 92.89% did.
Fees explain a large part of that gap, and they compound against you. Take $10,000 growing at an assumed 7% a year before costs. After 30 years it becomes about $75,500 in a fund charging 0.03%, about $72,400 at 0.18%, and about $57,400 at 1.00%. The difference between the cheapest and the priciest fund is more than $18,000 on a single $10,000 investment.
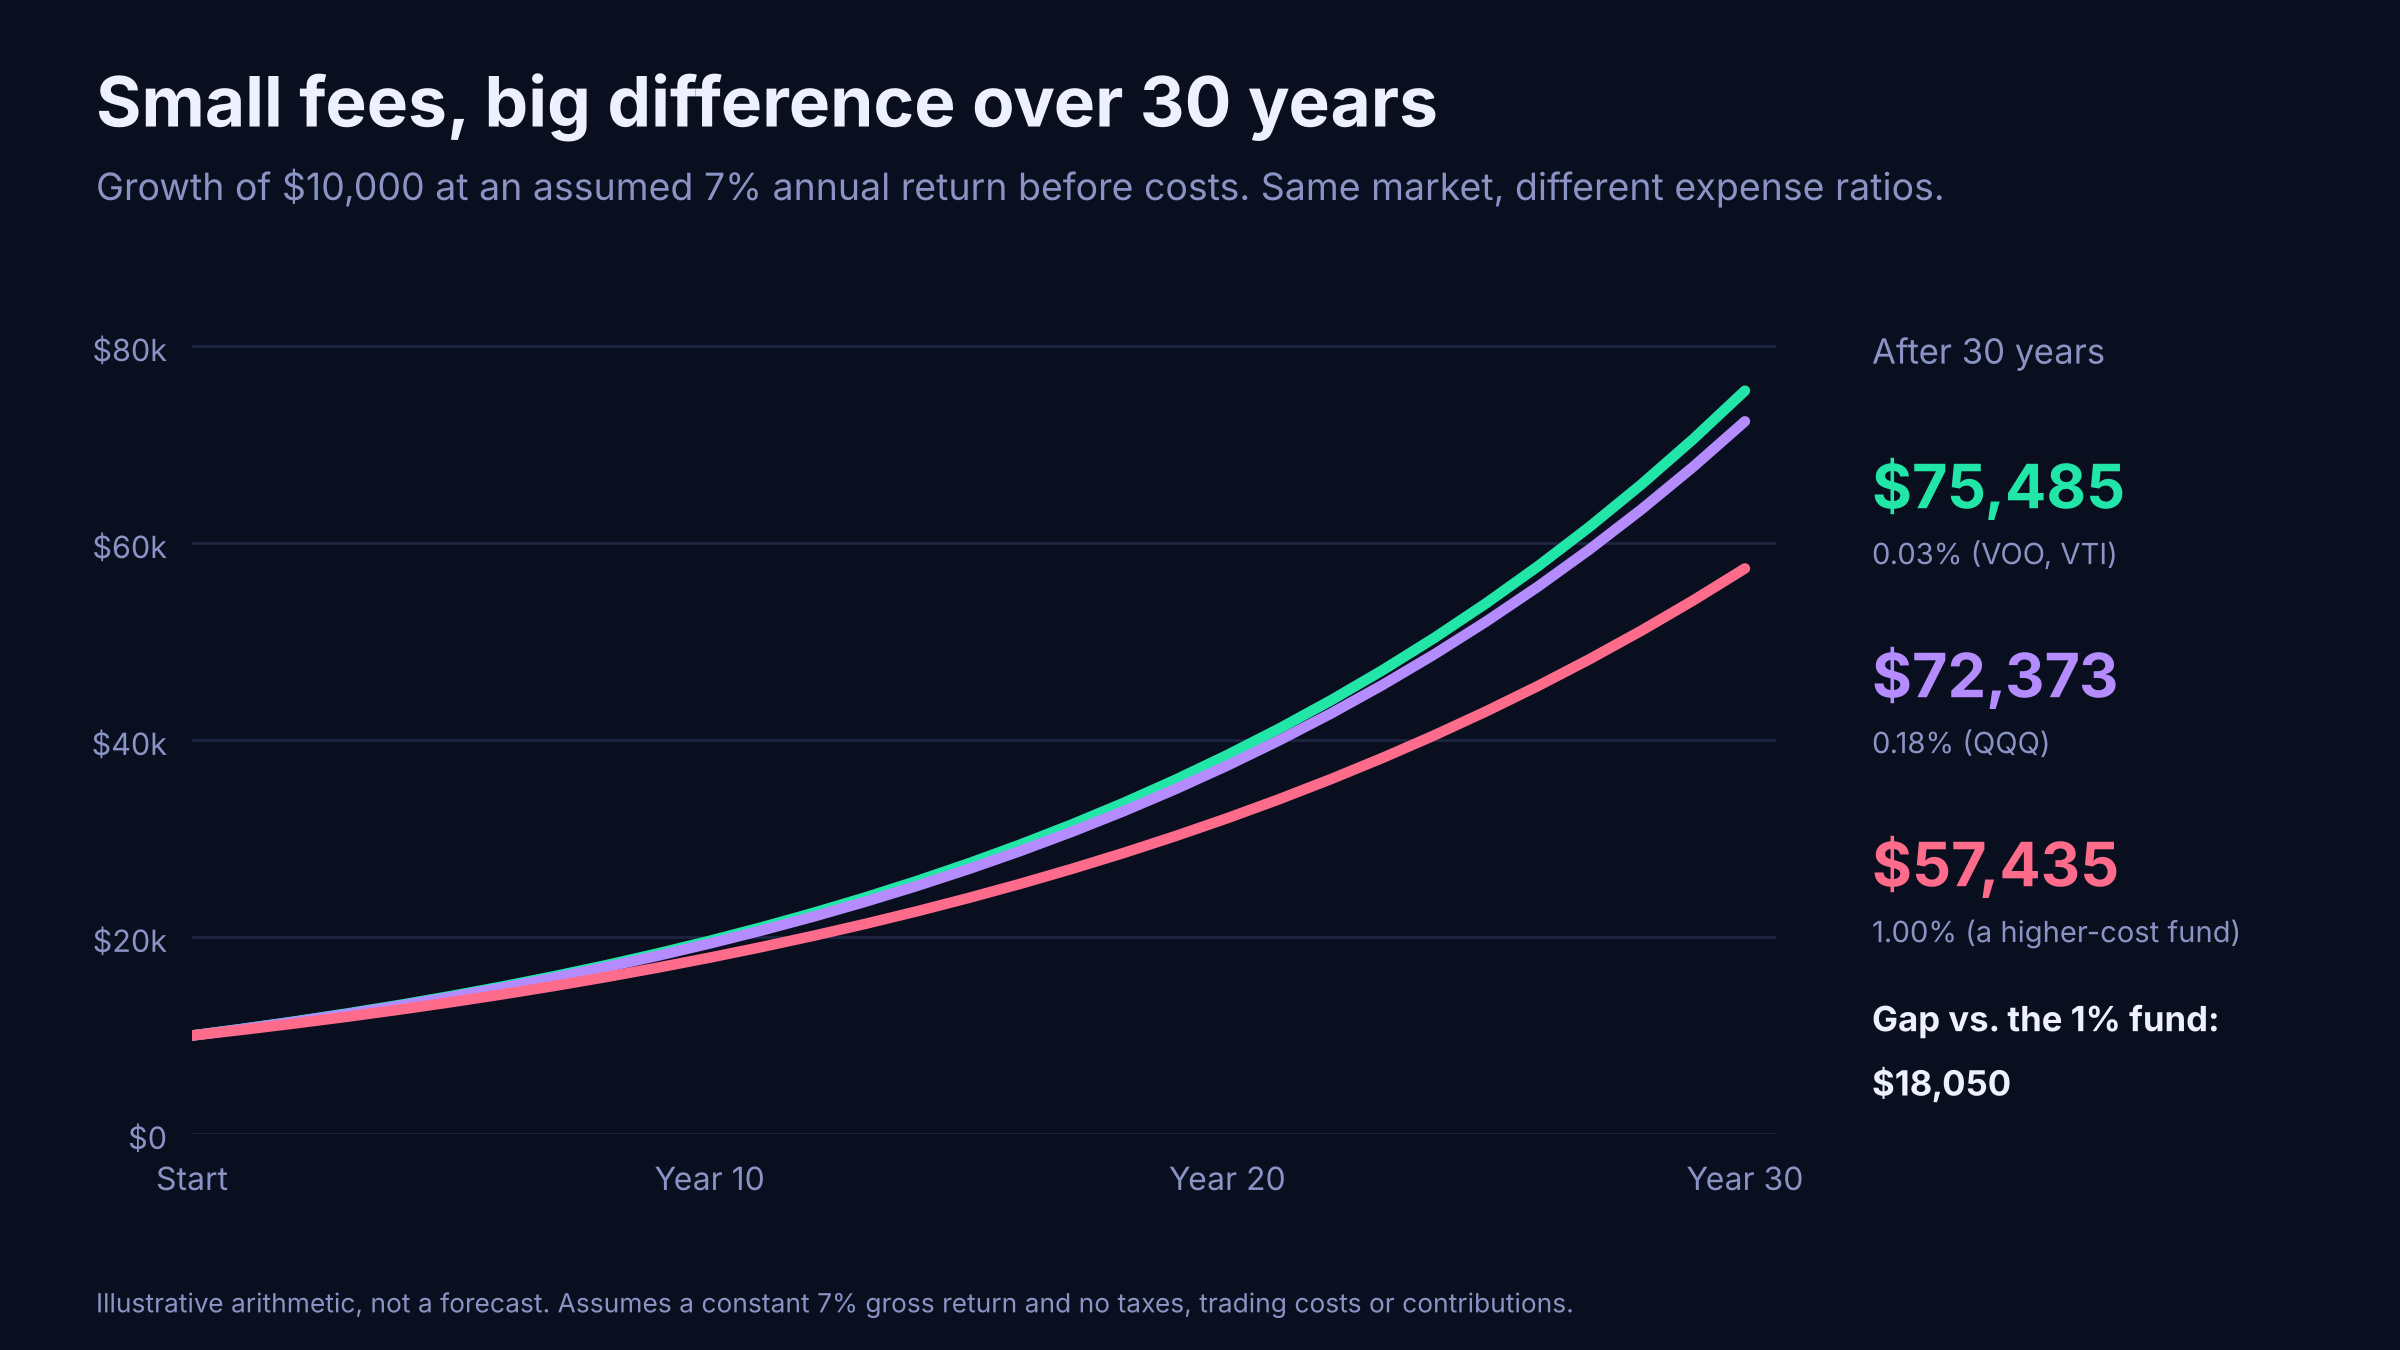
That chart is illustrative arithmetic, not a forecast. The point is the shape: costs are certain, returns are not.
The four core funds
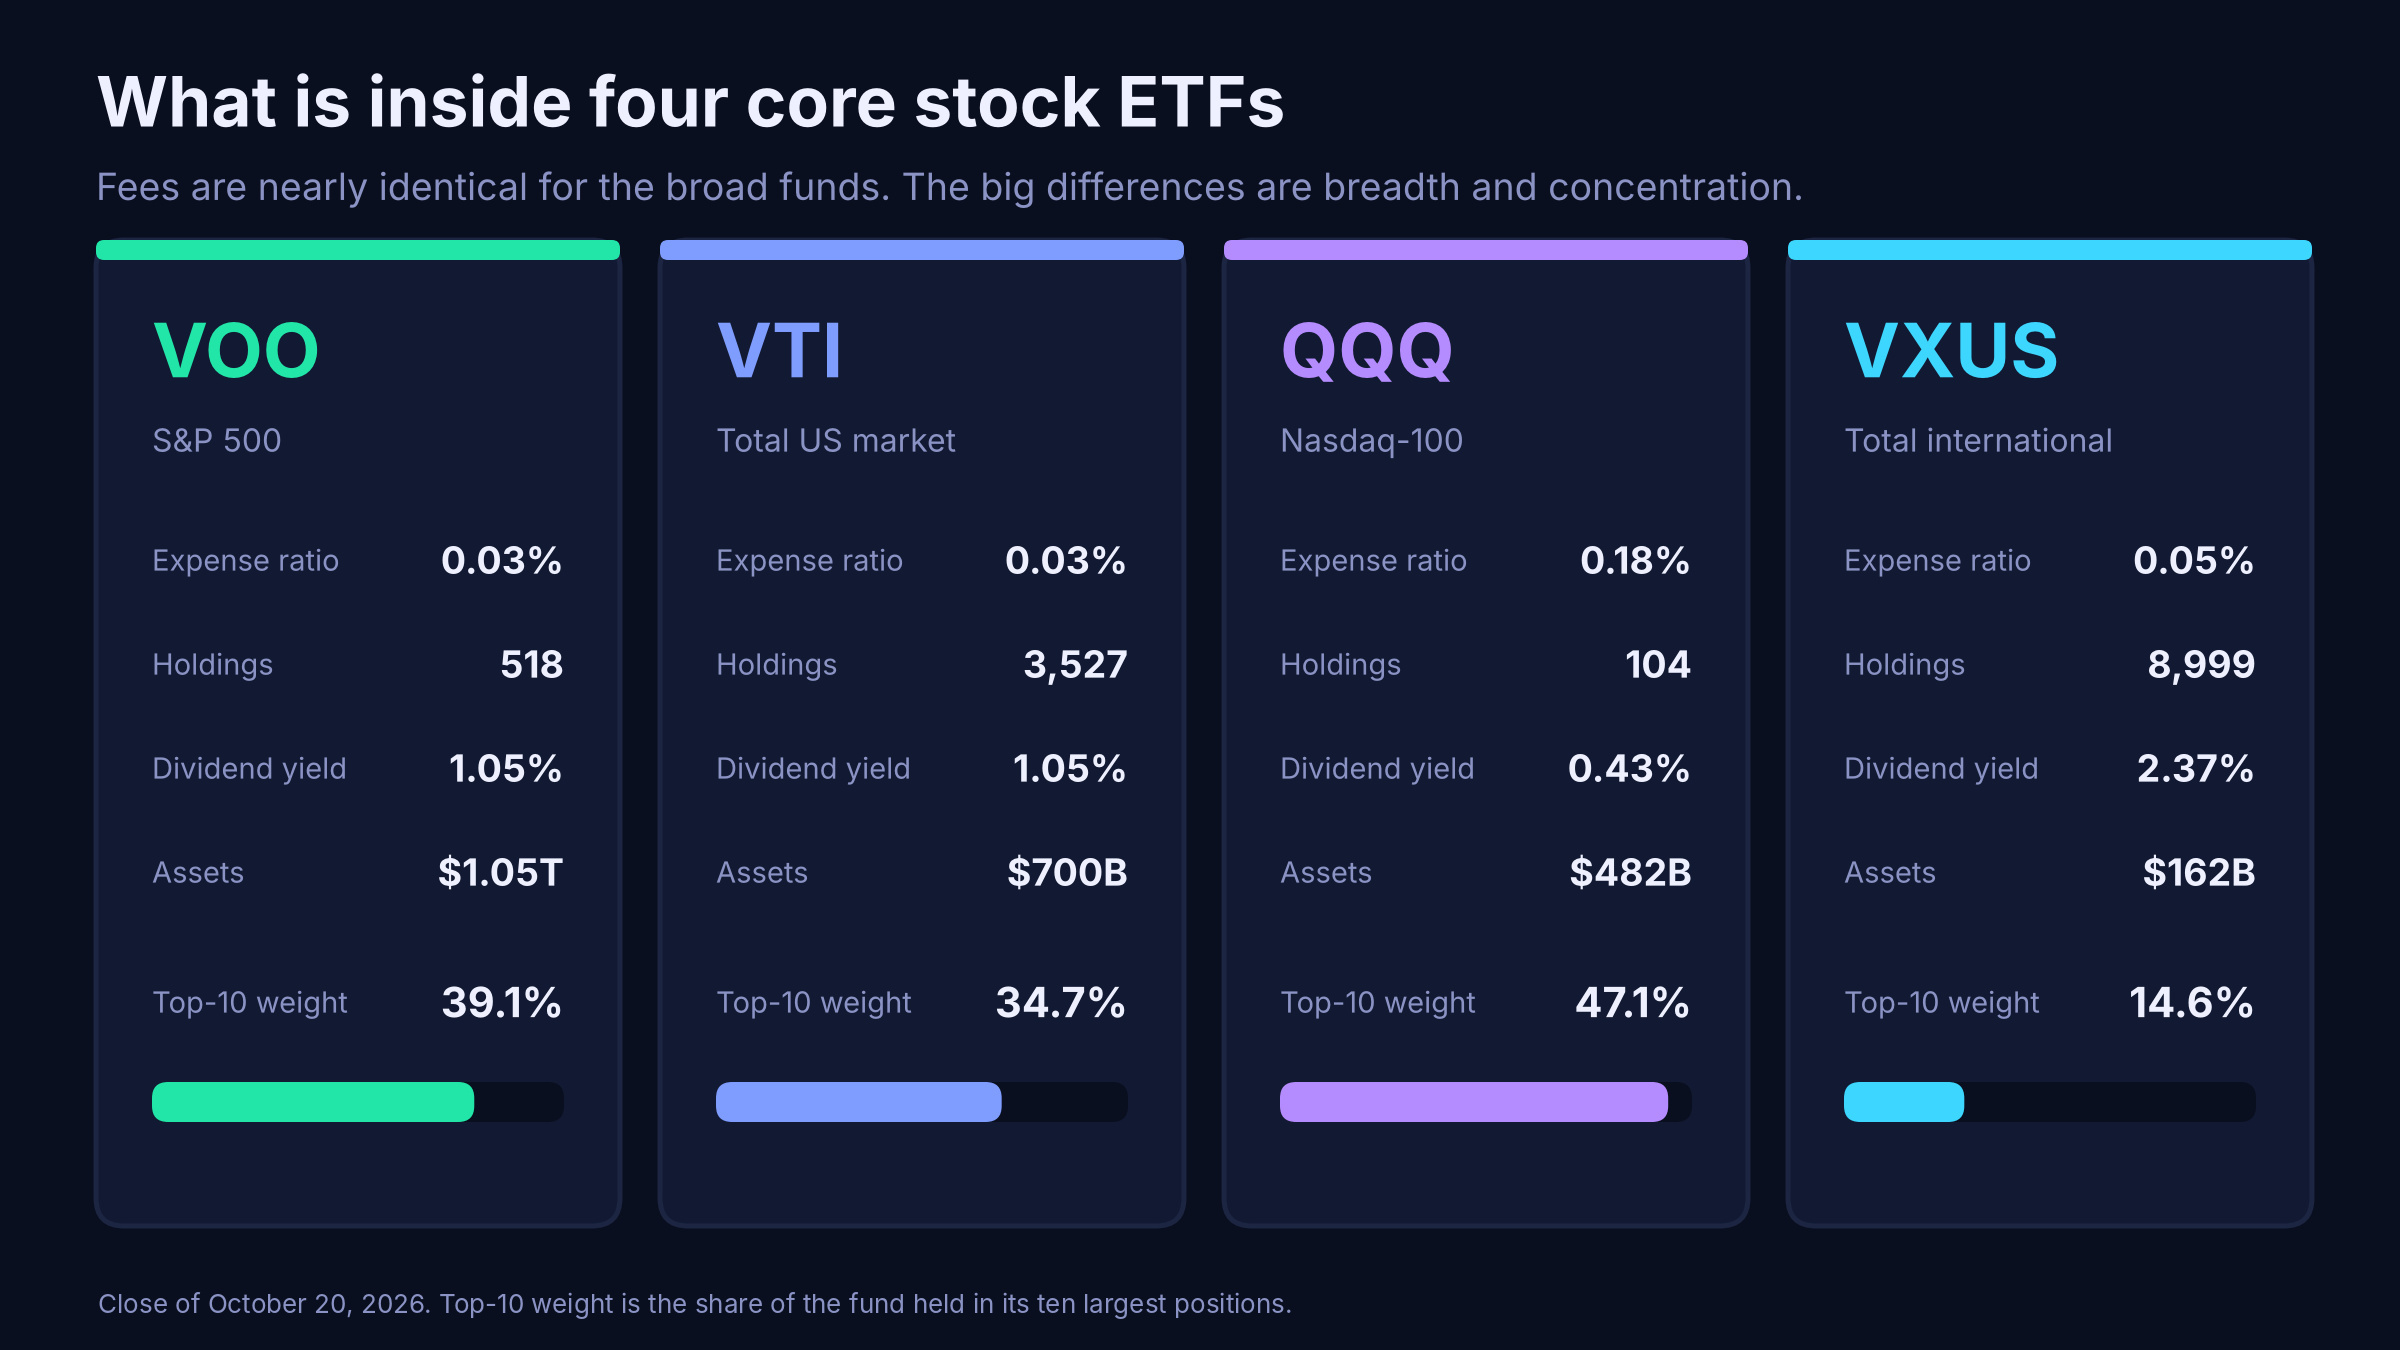
Four funds cover most of what a long-term stock investor needs: the S&P 500, the total US market, the Nasdaq-100 and the rest of the world. Here is what each held as of the close on October 20, 2026.
| Fund | Tracks | Fee | Holdings | Top-10 weight | 1-year return |
|---|---|---|---|---|---|
| VOO | S&P 500 | 0.03% | 518 | 39.11% | 17.06% |
| VTI | Total US stock market | 0.03% | 3,527 | 34.67% | 16.53% |
| QQQ | Nasdaq-100 | 0.18% | 104 | 47.11% | 19.39% |
| VXUS | Non-US stocks | 0.05% | 8,999 | 14.60% | 15.78% |
The one-year column is context, not a selection tool. All four landed within four percentage points of each other, and a single year says little about the next thirty. What the table does show is structure: how many companies you own and how much rides on the ten biggest.
VOO and VTI: nearly the same bet
VOO became the first ETF to pass $1 trillion in assets in June. It owns the 500 large US companies in the S&P 500. VTI owns the whole US market, about 3,500 stocks including mid-size and small companies. Both charge 0.03%.
In practice the two behave almost identically, because the largest companies dominate both. NVIDIA, Apple and Microsoft are the top three holdings in each fund, and the ten largest positions make up 39% of VOO and 35% of VTI. The extra 3,000 small and mid-size stocks in VTI add breadth at the margin, not a different return profile.
The practical choice comes down to preference. VOO is a pure large-cap index. VTI adds smaller companies and a longer track record, with an inception date of 2001 against 2010 for VOO. Siblings exist too: IVV tracks the S&P 500 for 0.03%, while SPY charges 0.09%, which is $9 a year per $10,000 instead of $3.
QQQ: the growth tilt, and what it costs
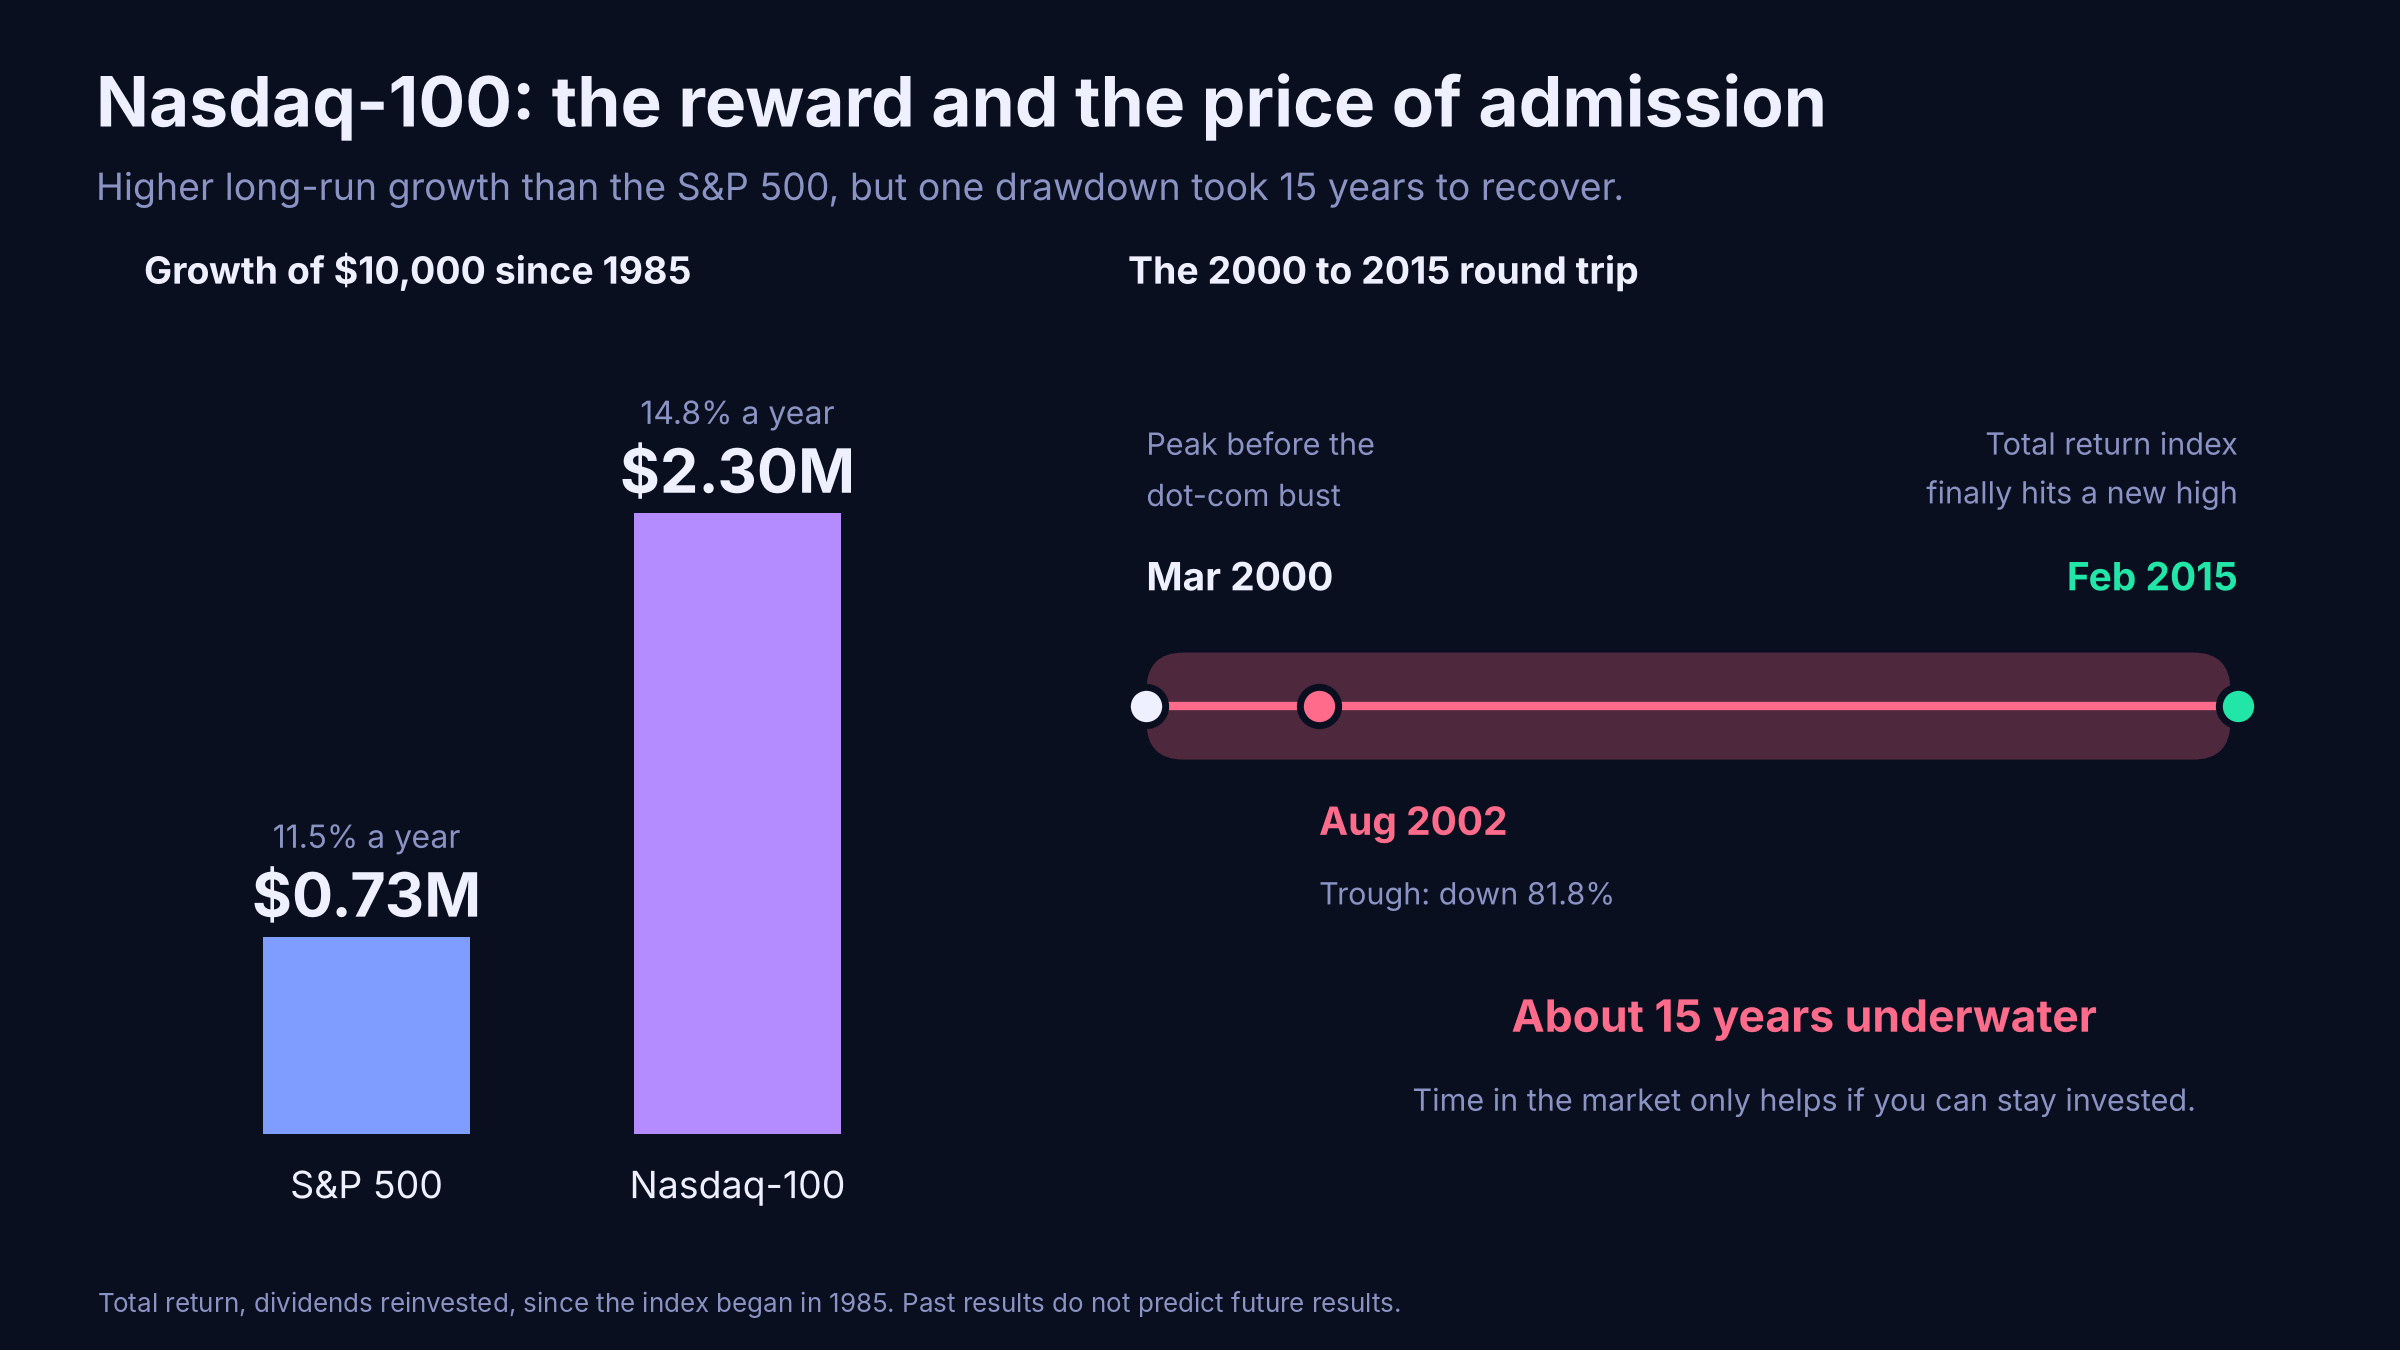
QQQ tracks the Nasdaq-100, an index of about 100 of the largest non-financial companies listed on the Nasdaq exchange. It holds about $482 billion and charges 0.18%. Its record is strong: since the index began in 1985, the Nasdaq-100 compounded at about 14.8% a year against 11.5% for the S&P 500, with dividends reinvested. On CME's figures, $10,000 invested in 1985 would have grown to roughly $2.3 million in the Nasdaq-100, against about $730,000 in the S&P 500.
The cost of that concentration is documented. The Nasdaq-100 began falling on March 28, 2000 and was down 81.76% by August 5, 2002. Its total return index did not reach a new high until February 12, 2015.
Three features matter for a long-term holder:
- Concentration. The top 10 holdings are 47.11% of the fund, and the top three (NVIDIA, Apple, Microsoft) alone are about 22%.
- Sector dependence. CME found the index's correlation with the S&P 500 information technology index has never fallen below +0.9.
- Rate sensitivity. Rising long-term yields lower the present value of future earnings, which CME links to the 2022 selloff. The 10-year Treasury yield was 5.15% on October 19.
None of this makes QQQ a poor fund. It makes it a different kind of fund from VOO: a deliberate tilt toward growth and technology, which has been well rewarded and can be punished for a decade or more. QQQM tracks the same index, so compare its fee and trading volume with QQQ's before choosing between the two.
The overlap problem
Owning VOO and QQQ together feels like diversification. It is less than it looks. Nine of the ten largest holdings are the same in both funds: NVIDIA, Apple, Microsoft, Amazon, both Alphabet share classes, Meta, Micron and Tesla. Only Broadcom (in VOO's top ten) and AMD (in QQQ's) differ.
That sits on top of a bigger shift inside the S&P 500 itself. The ten largest stocks now make up roughly 40% of the index's value, up from about 19% ten years ago. Their share of the index's earnings is about 32%, up from 19%.
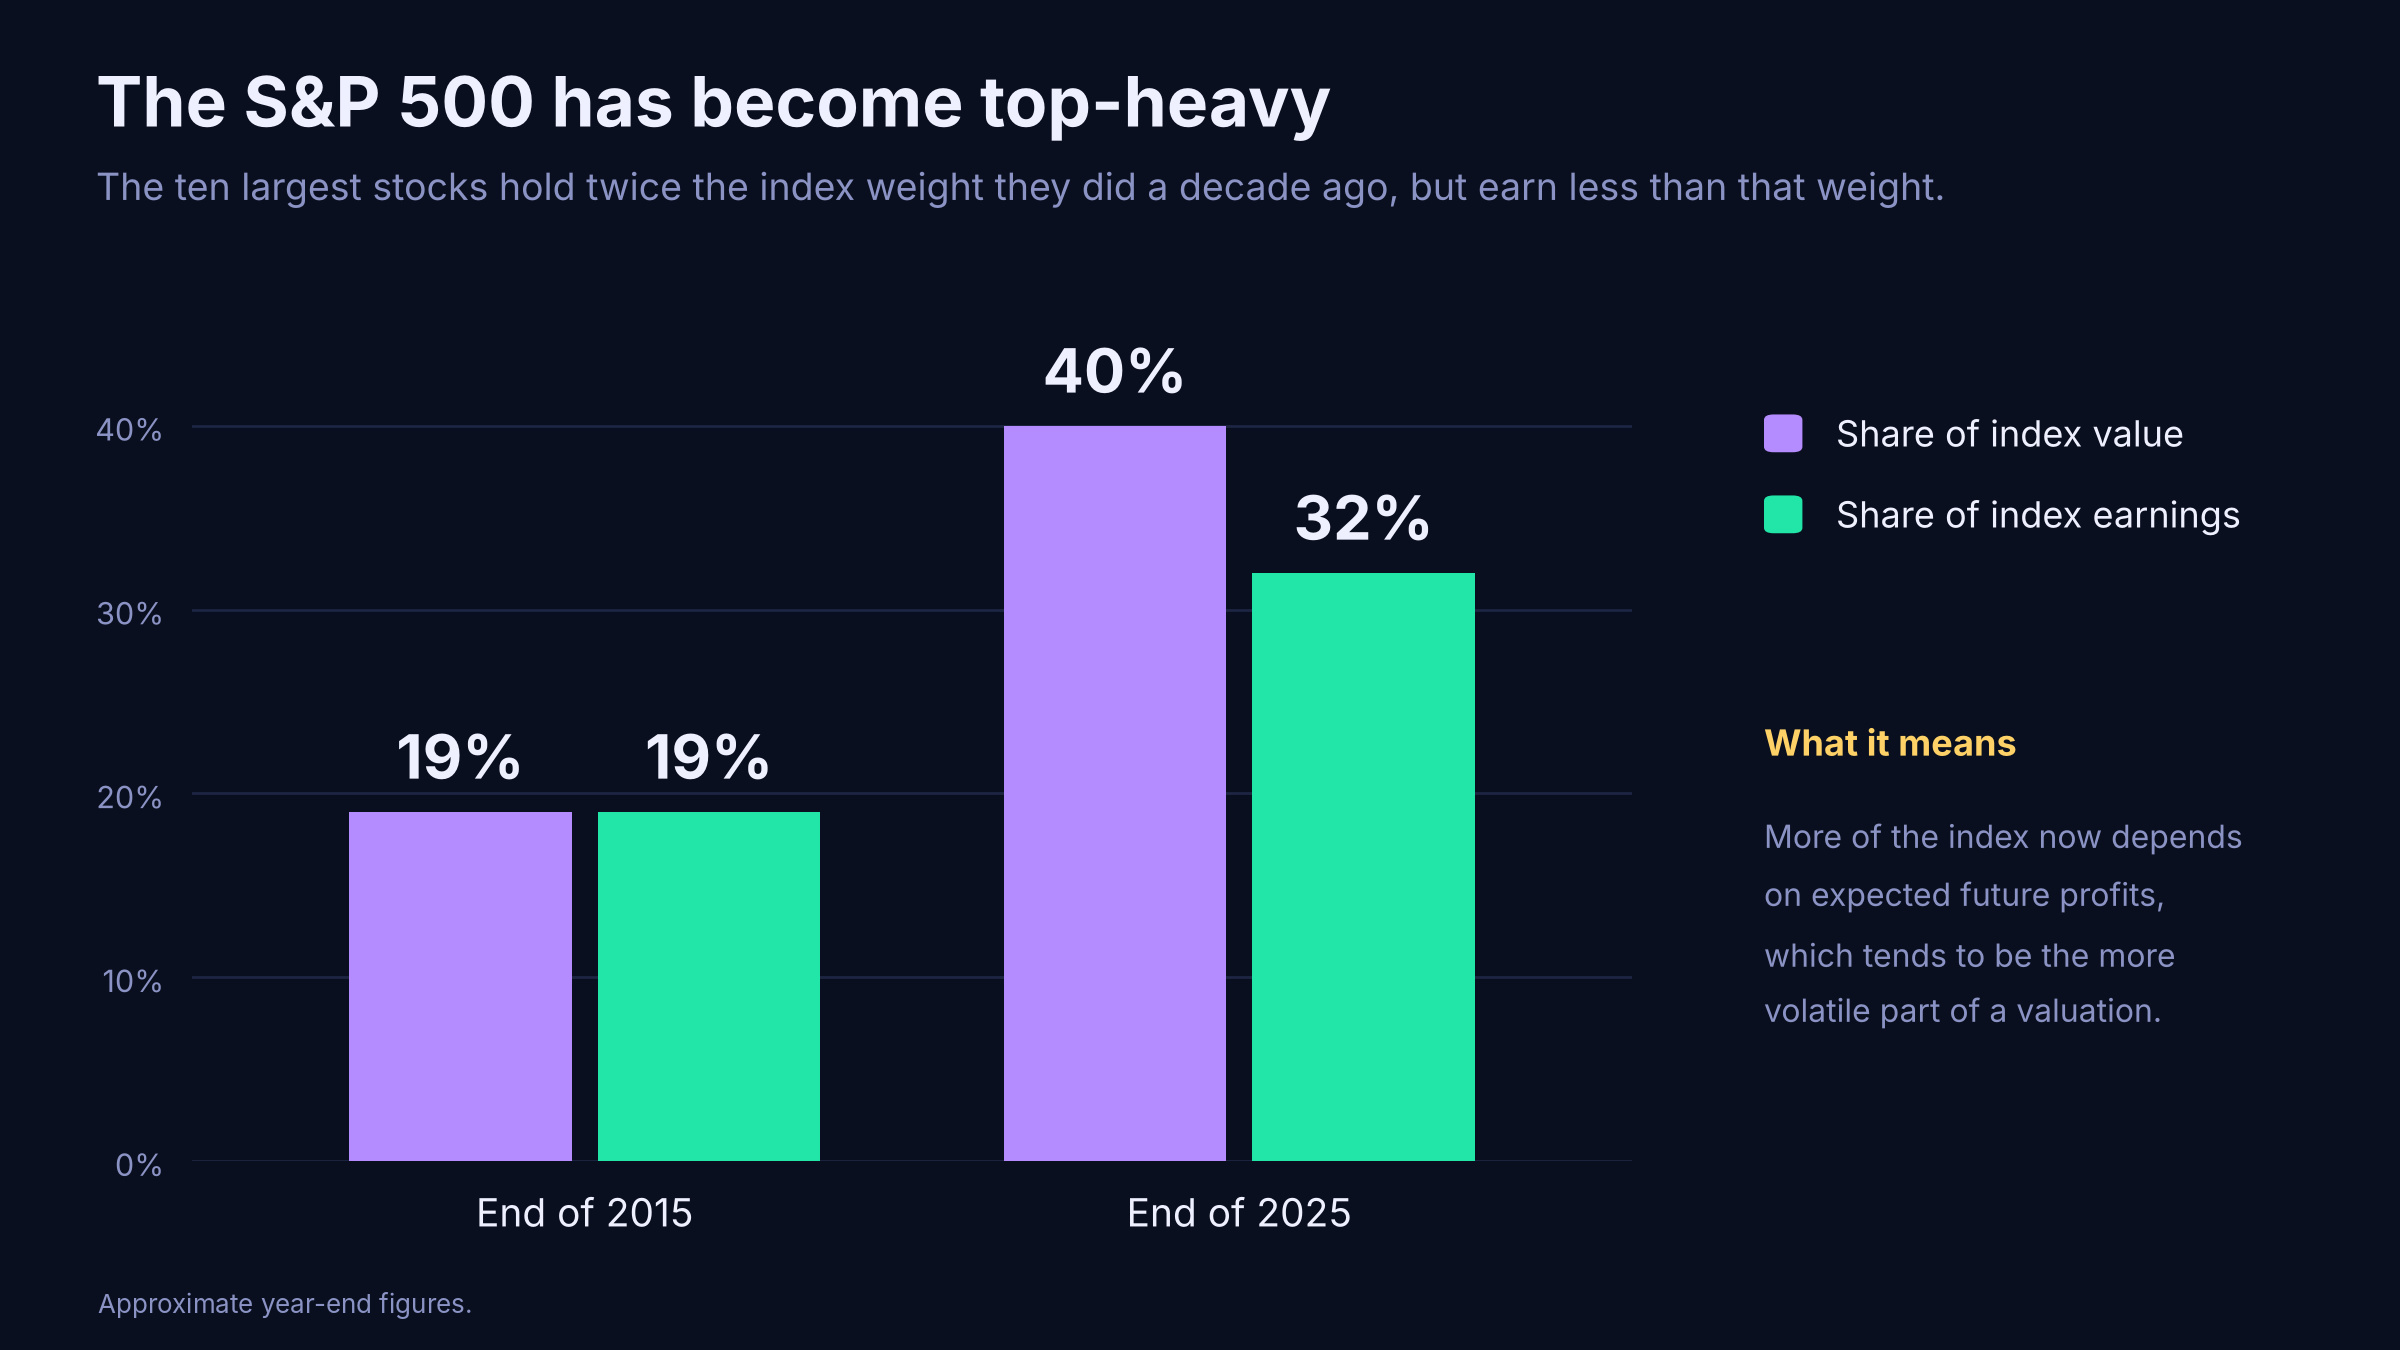
The gap between 40% and 32% means more of the index now rests on expected future profits, which is the more volatile part of a valuation. It is worth noting that concentration is a characteristic to understand, not a signal to sell. For a long-term investor the useful step is simple: compare the top-10 lists of every fund you hold, and know how much of your portfolio is really one theme.
VXUS: the diversifier
VXUS holds nearly 9,000 stocks outside the United States for 0.05% a year. Its ten largest positions are only 14.60% of the fund, and the top names are Taiwan Semiconductor (4.27%), Samsung (2.03%), SK hynix (1.67%) and ASML (1.55%). Its dividend yield is 2.37%, against 1.05% for VOO.
The case for it is not that international stocks must outperform. It is that they are a different bet: other economies, other currencies and a much flatter concentration profile. The cost is currency risk and the possibility of lagging US stocks for long stretches.
Dividend-growth funds: VIG and SCHD
Investors who want a quality tilt often add a dividend-growth fund. As of late May 2026, VIG (0.04% fee) held about 340 companies that have raised dividends for at least 10 straight years, with a yield near 1.5%. SCHD (0.06%) held 100 stocks screened on yield, cash-flow-to-debt, return on equity and dividend growth, with a yield near 3.2%. That source flags inconsistent page timestamps, so verify current figures with the fund providers.
Neither fund is a free lunch. SCHD leans toward financials, health care, consumer staples and energy, while VIG sits closer to the broad market with technology among its top sectors. Both change what you own, not whether you are exposed to stock-market risk.
Four ways investors combine them
These are illustrative structures, not recommendations, and none implies a particular weighting.
| Approach | Typical funds | What you accept |
|---|---|---|
| One-fund core | VTI or VOO | US-only exposure and a top-heavy index |
| Global core | VTI or VOO plus VXUS | Currency risk and years when the US leads |
| Growth tilt | A core fund plus QQQ | Overlap and deeper drawdowns |
| Income tilt | A core fund plus VIG or SCHD | Narrower holdings and sector bets |
Read our guide to the eight kinds of ETFs for how bond, gold and other funds fit around a stock core.
Habits that matter more than the fund you pick
- Keep costs low. Between nearly identical funds, the cheaper one wins on arithmetic alone.
- Invest on a schedule. Regular contributions remove the need to time the market.
- Reinvest dividends and rebalance occasionally. Review the portfolio about once a year, and compare top-10 holdings when you do.
- Hold through drawdowns you planned for. The Nasdaq-100's 2000 to 2015 round trip is the reminder: a strategy only works if you can stay in it.
- Match the account to the fund. Dividend funds and growth funds are taxed differently, so check where they sit.
Risks to keep in view
Stock ETFs diversify away single-company risk, not market risk. A broad index can fall sharply, and recovery can take years, as the Nasdaq-100's 81.76% drop showed. Rising interest rates, with the 10-year at 5.15%, put pressure on growth valuations. Concentration in a handful of AI-linked companies means the index may behave less diversified in a downturn than its 500 or 3,500 names suggest. International funds add currency swings.
Bottom line
For long-term investors, the evidence favors owning the market cheaply and staying invested. VOO and VTI are close substitutes for the core. VXUS adds the rest of the world. QQQ is a growth tilt with a record of strong returns and one brutal drawdown, and it overlaps heavily with the S&P 500. Fees and behavior will decide more of your outcome than which of these tickers you pick.
Disclaimer: This article is reference information only. It is not investment advice, a recommendation, or a solicitation to buy or sell any security. Investments can lose value, and past performance does not predict future results. Do your own research or consult a licensed adviser.