
The Viral ETF Tier List, Fact-Checked: VT, VOO, VTI, VUG, QQQM, SPY and SCHD in 2026
A popular social-media ETF tier list put VT on top and SCHD near the bottom. Here is what the numbers say about each fund: fees, holdings, concentration, overlap and structure.
Reference information only. This article is not investment advice, a recommendation, or a solicitation to buy or sell any security. ETFs can lose money, sometimes sharply and for years. A tier list is an opinion, including the one discussed here. Figures are as of the dates shown and may already be out of date. Check each fund's prospectus and consider your own situation before acting.
What the tier list says
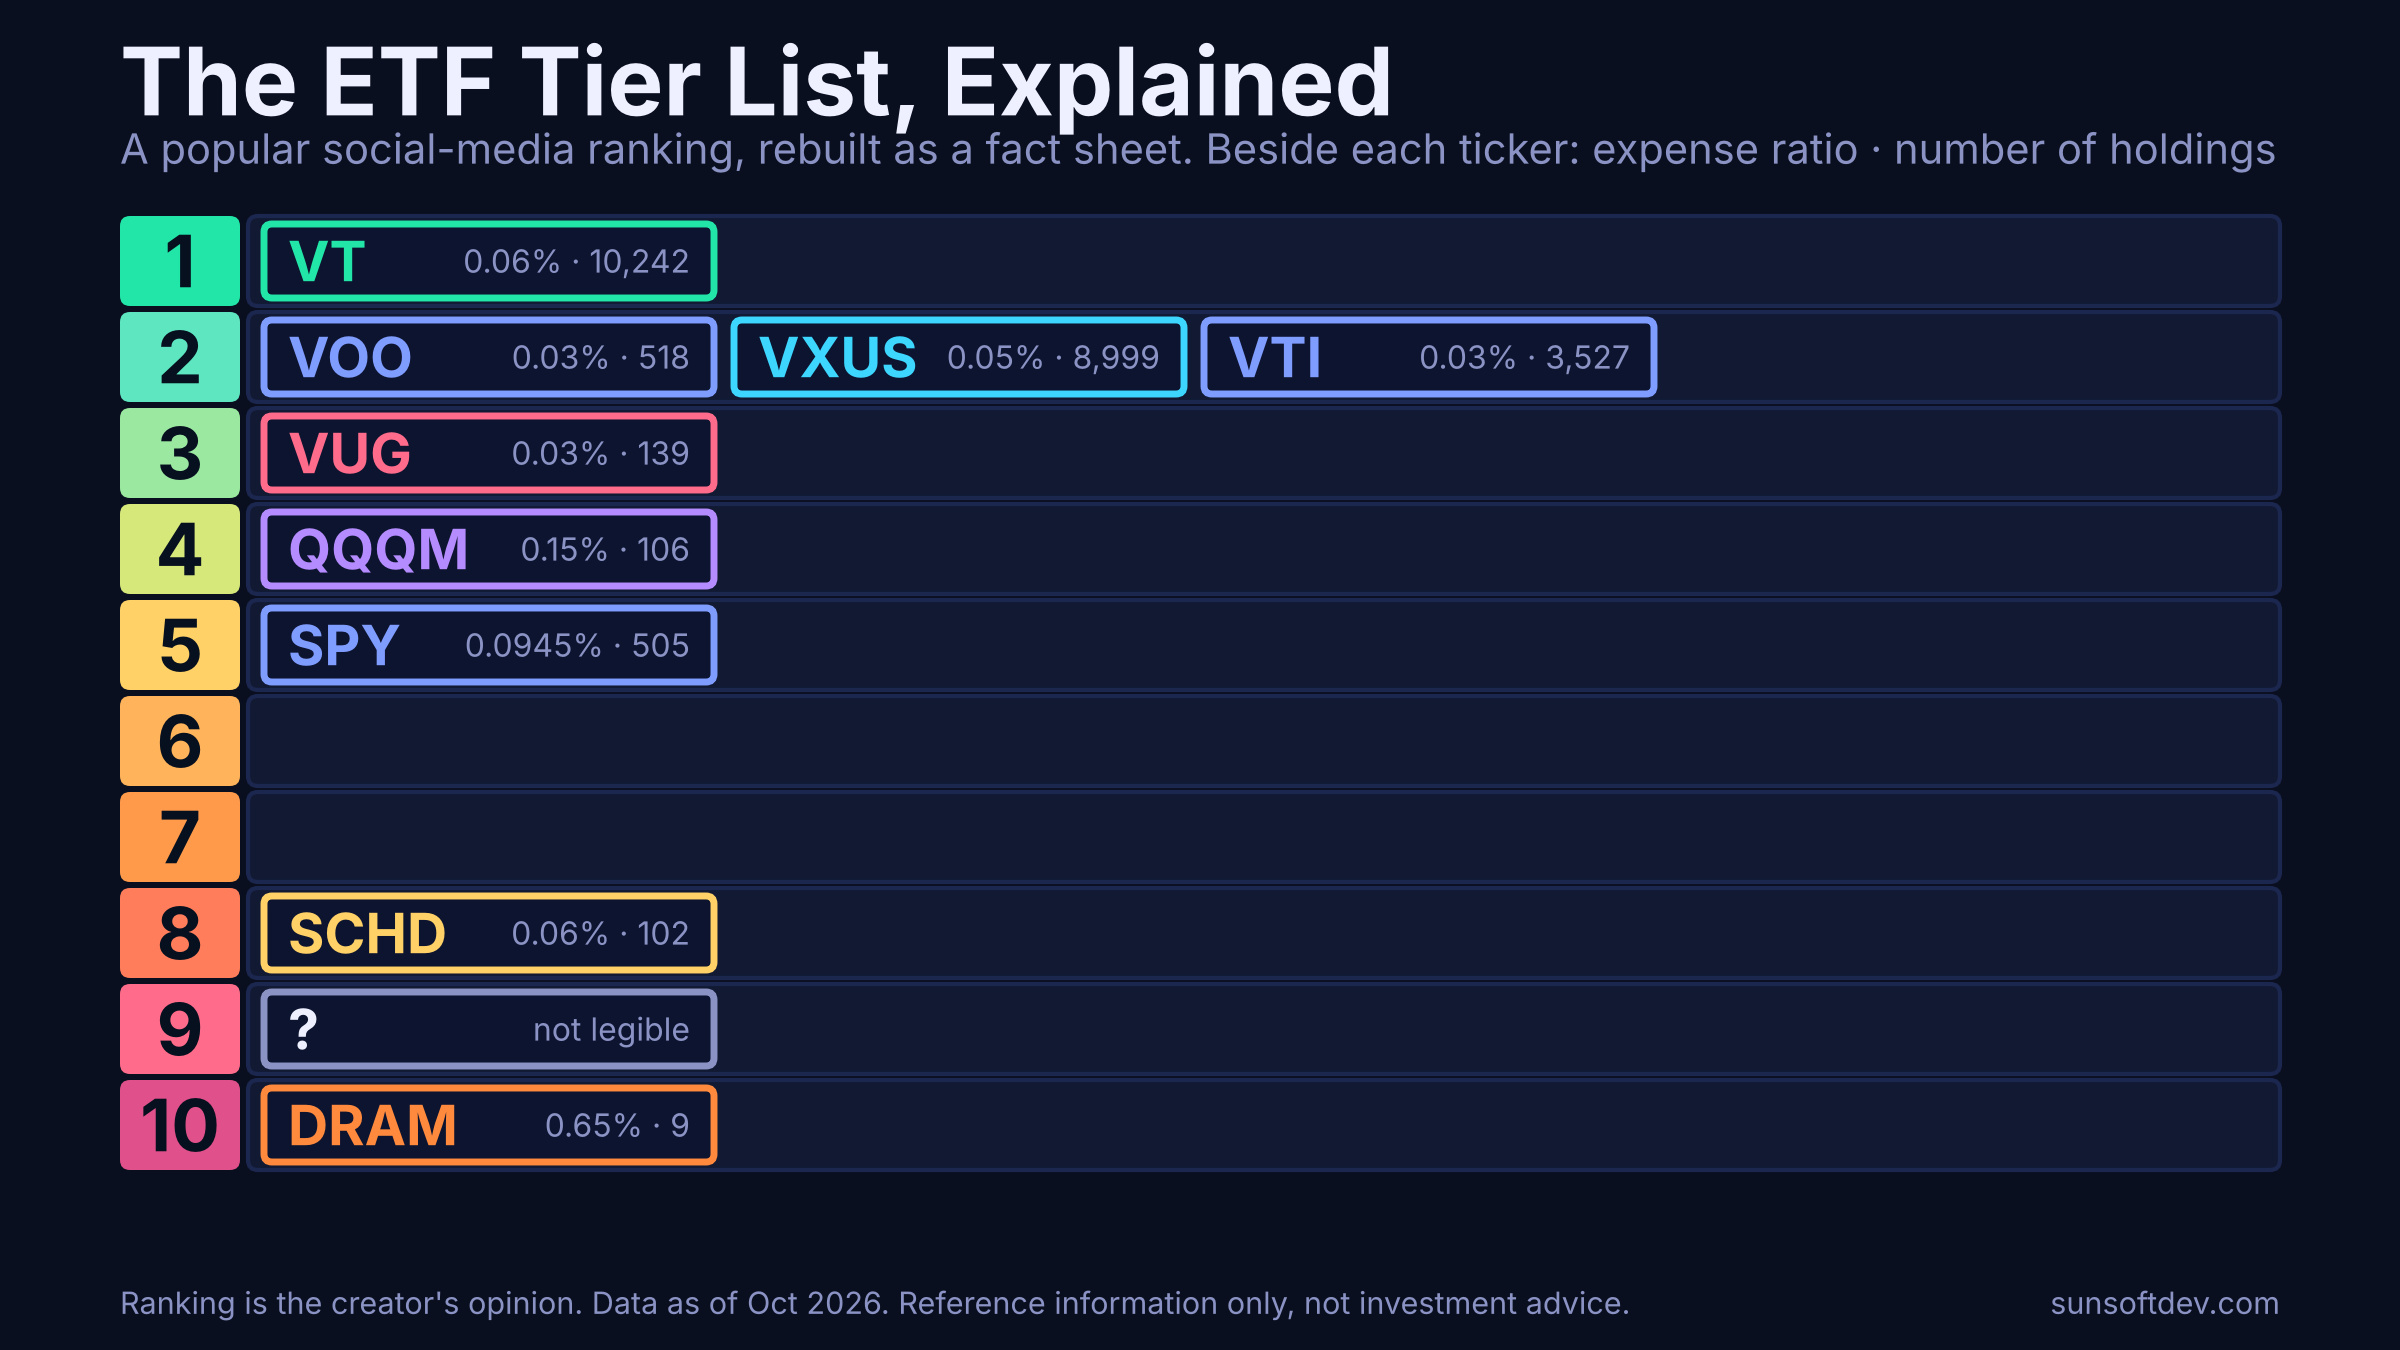
A short Instagram video ranked popular ETFs into ten tiers. As shown in the screenshot, it reads like this:
- Tier 1: VT
- Tier 2: VOO, VXUS and VTI
- Tier 3: VUG
- Tier 4: QQQM
- Tier 5: SPY
- Tiers 6 and 7: empty
- Tier 8: SCHD
- Tier 10: a tile that appears to read DRAM
Tier 9 holds an avatar-style tile that is not legible in the screenshot, so this article leaves it out rather than guessing.
The screenshot shows rankings but no scoring method, so treat it as one creator's view of how well each fund works as a long-term holding. The board above is our own rebuild of the same ordering, with fund facts added. What follows checks the ordering against data, fund by fund. It is not a case for or against anyone's ranking.
First, what a tier list can and cannot tell you
A tier list compresses several questions into one number. For ETFs, four of them matter most:
- Breadth. How many companies and countries does the fund cover?
- Cost. What does it charge each year?
- Structure. How is the fund built, and does that limit what it can do?
- Job. Is it meant to be a core holding, a tilt, an income sleeve or a bet on one theme?
The order in this tier list looks closer to breadth and simplicity than to past returns. In the five-year data below, QQQM (tier 4) beat VT (tier 1). That is not a flaw in the list. It is a reminder that a ranking built on durability and diversification will not match a ranking built on recent performance.
The fund facts, side by side
These are figures as of October 20 and 21, 2026.
| Fund | What it tracks | Fee | Holdings | Top-10 weight | Yield | Assets |
|---|---|---|---|---|---|---|
| VT | Global stocks, all sizes | 0.06% | 10,242 | 22.45% | 1.53% | $81.9B |
| VOO | S&P 500 | 0.03% | 518 | 39.11% | 1.05% | $1.05T |
| VXUS | Non-US stocks | 0.05% | 8,999 | 14.60% | 2.37% | $161.9B |
| VTI | Total US stock market | 0.03% | 3,527 | 34.67% | 1.05% | $699.6B |
| VUG | US large-cap growth | 0.03% | 139 | 63.11% | 0.39% | $232.8B |
| QQQM | Nasdaq-100 | 0.15% | 106 | 47.13% | 0.45% | $107.3B |
| SPY | S&P 500 | 0.0945% | 505 | 38.69% | 0.99% | $813.3B |
| SCHD | Dow Jones U.S. Dividend 100 | 0.06% | 102 | 41.55% | 3.04% | $115.2B |
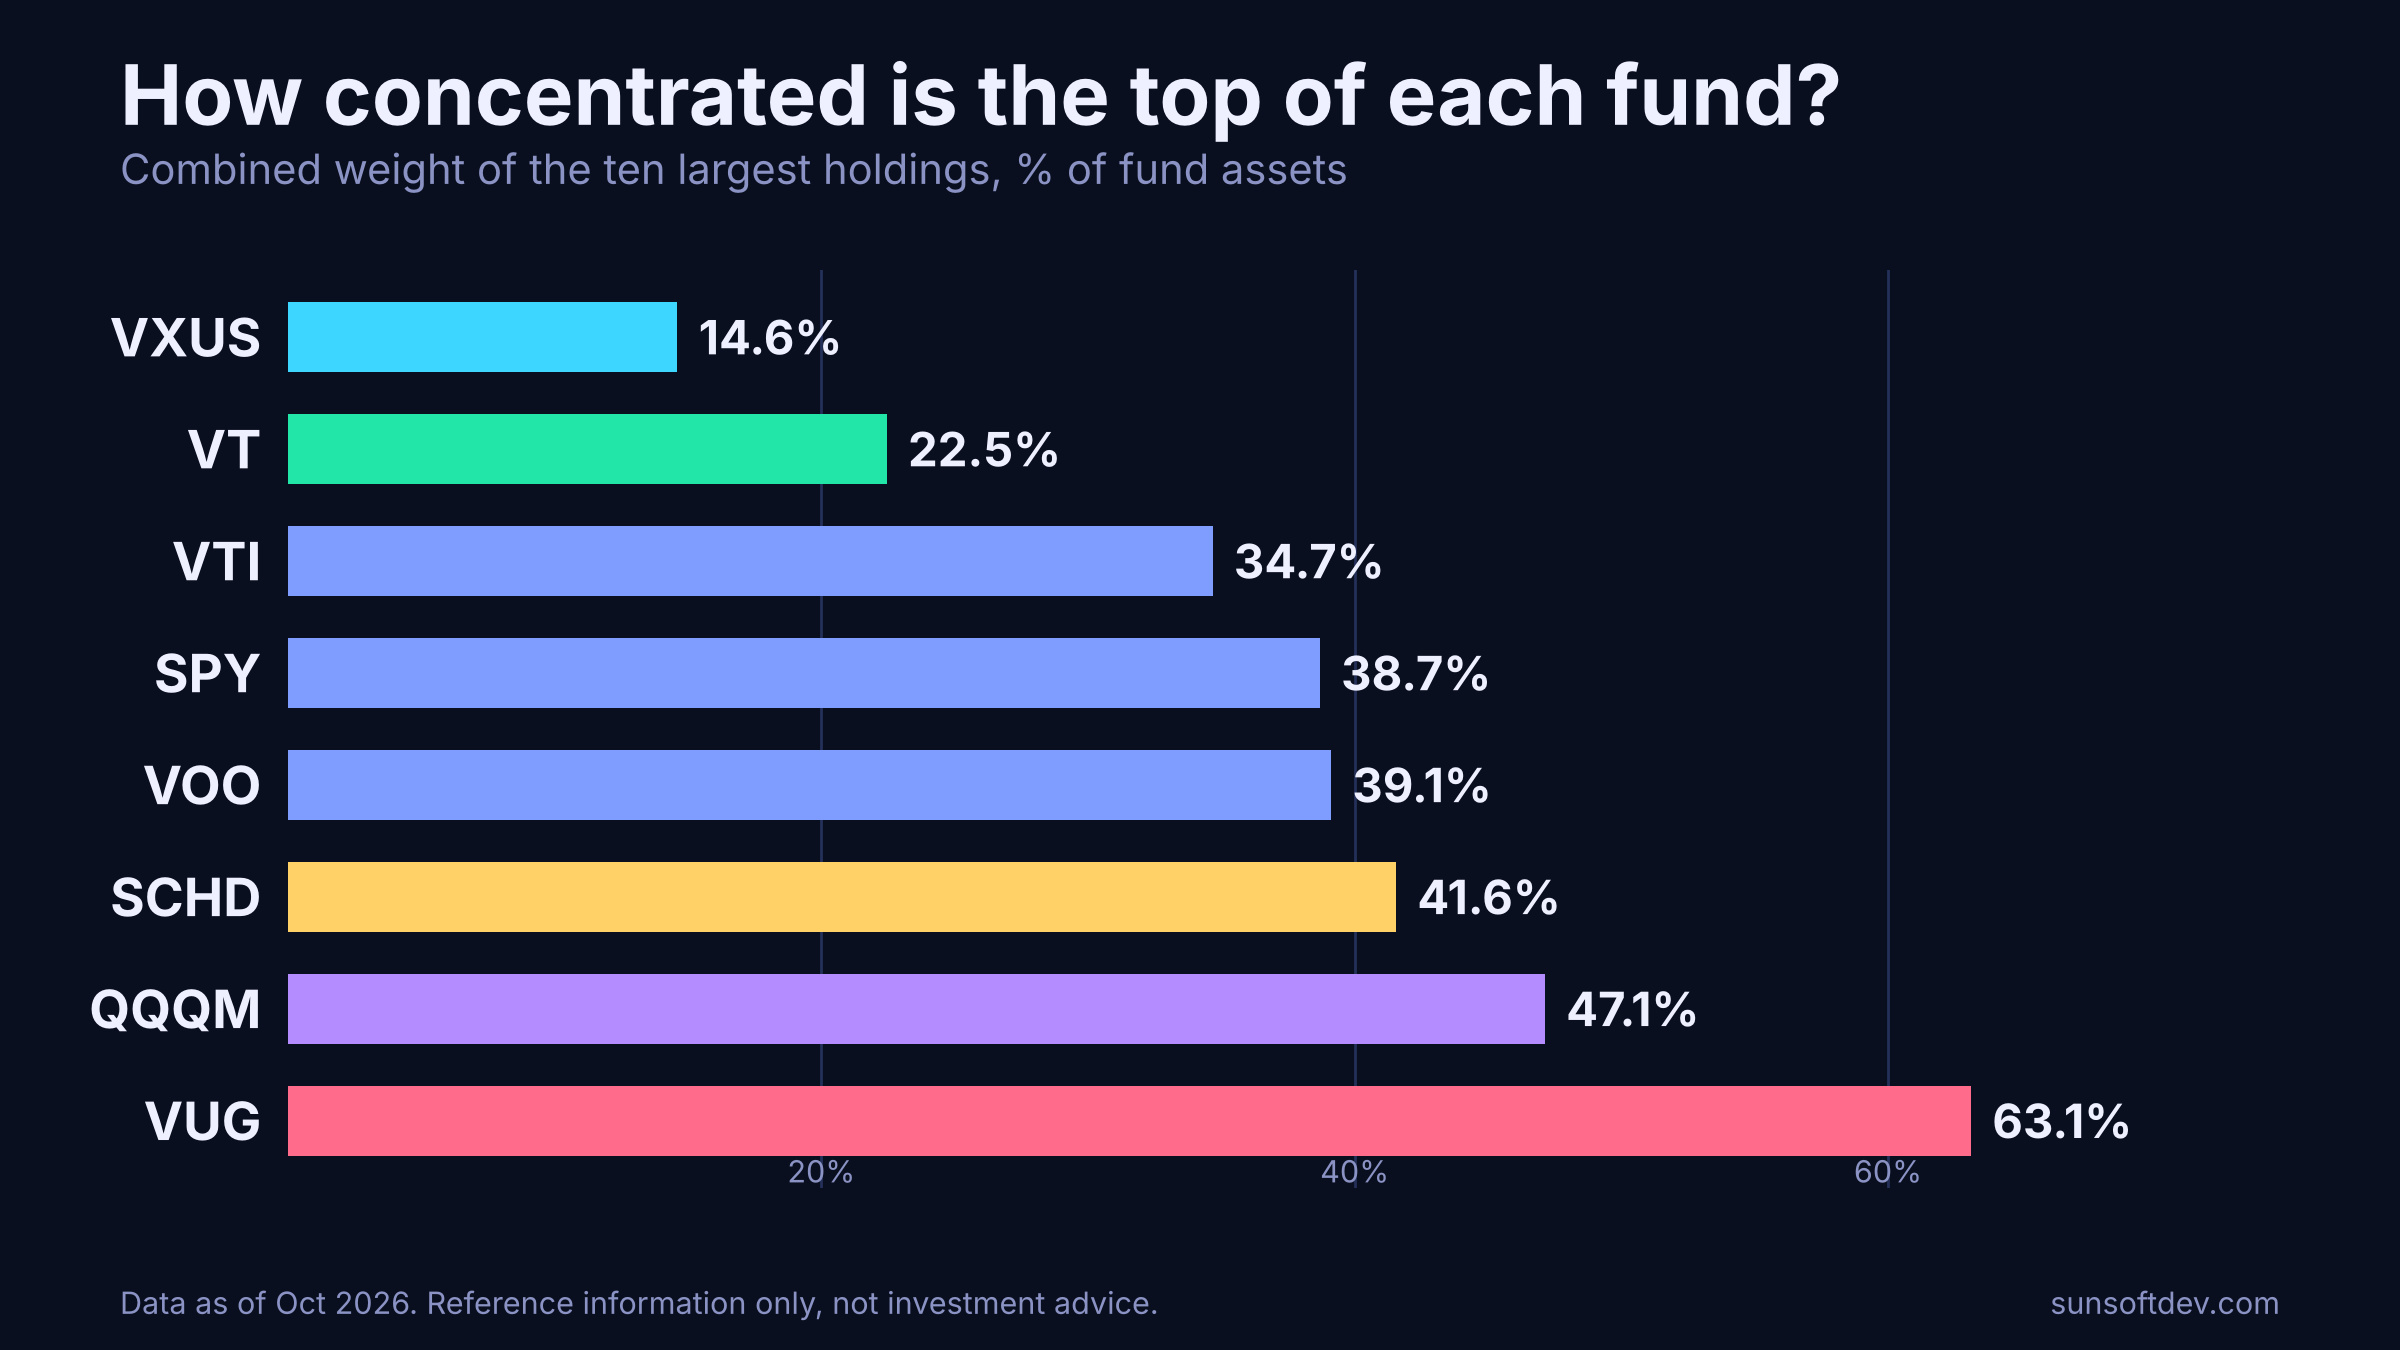
Two columns do most of the work: holdings and top-10 weight. They show how much you are spreading your bet and how much still rides on the largest names.
Tier 1, VT: the whole world in one ticker
VT is the broadest fund on the board. It holds 10,242 stocks, charges 0.06% and tracks a global all-cap index that includes small companies. Its top ten make up just 22.45% of assets, the lowest of any US-focused or global fund here.
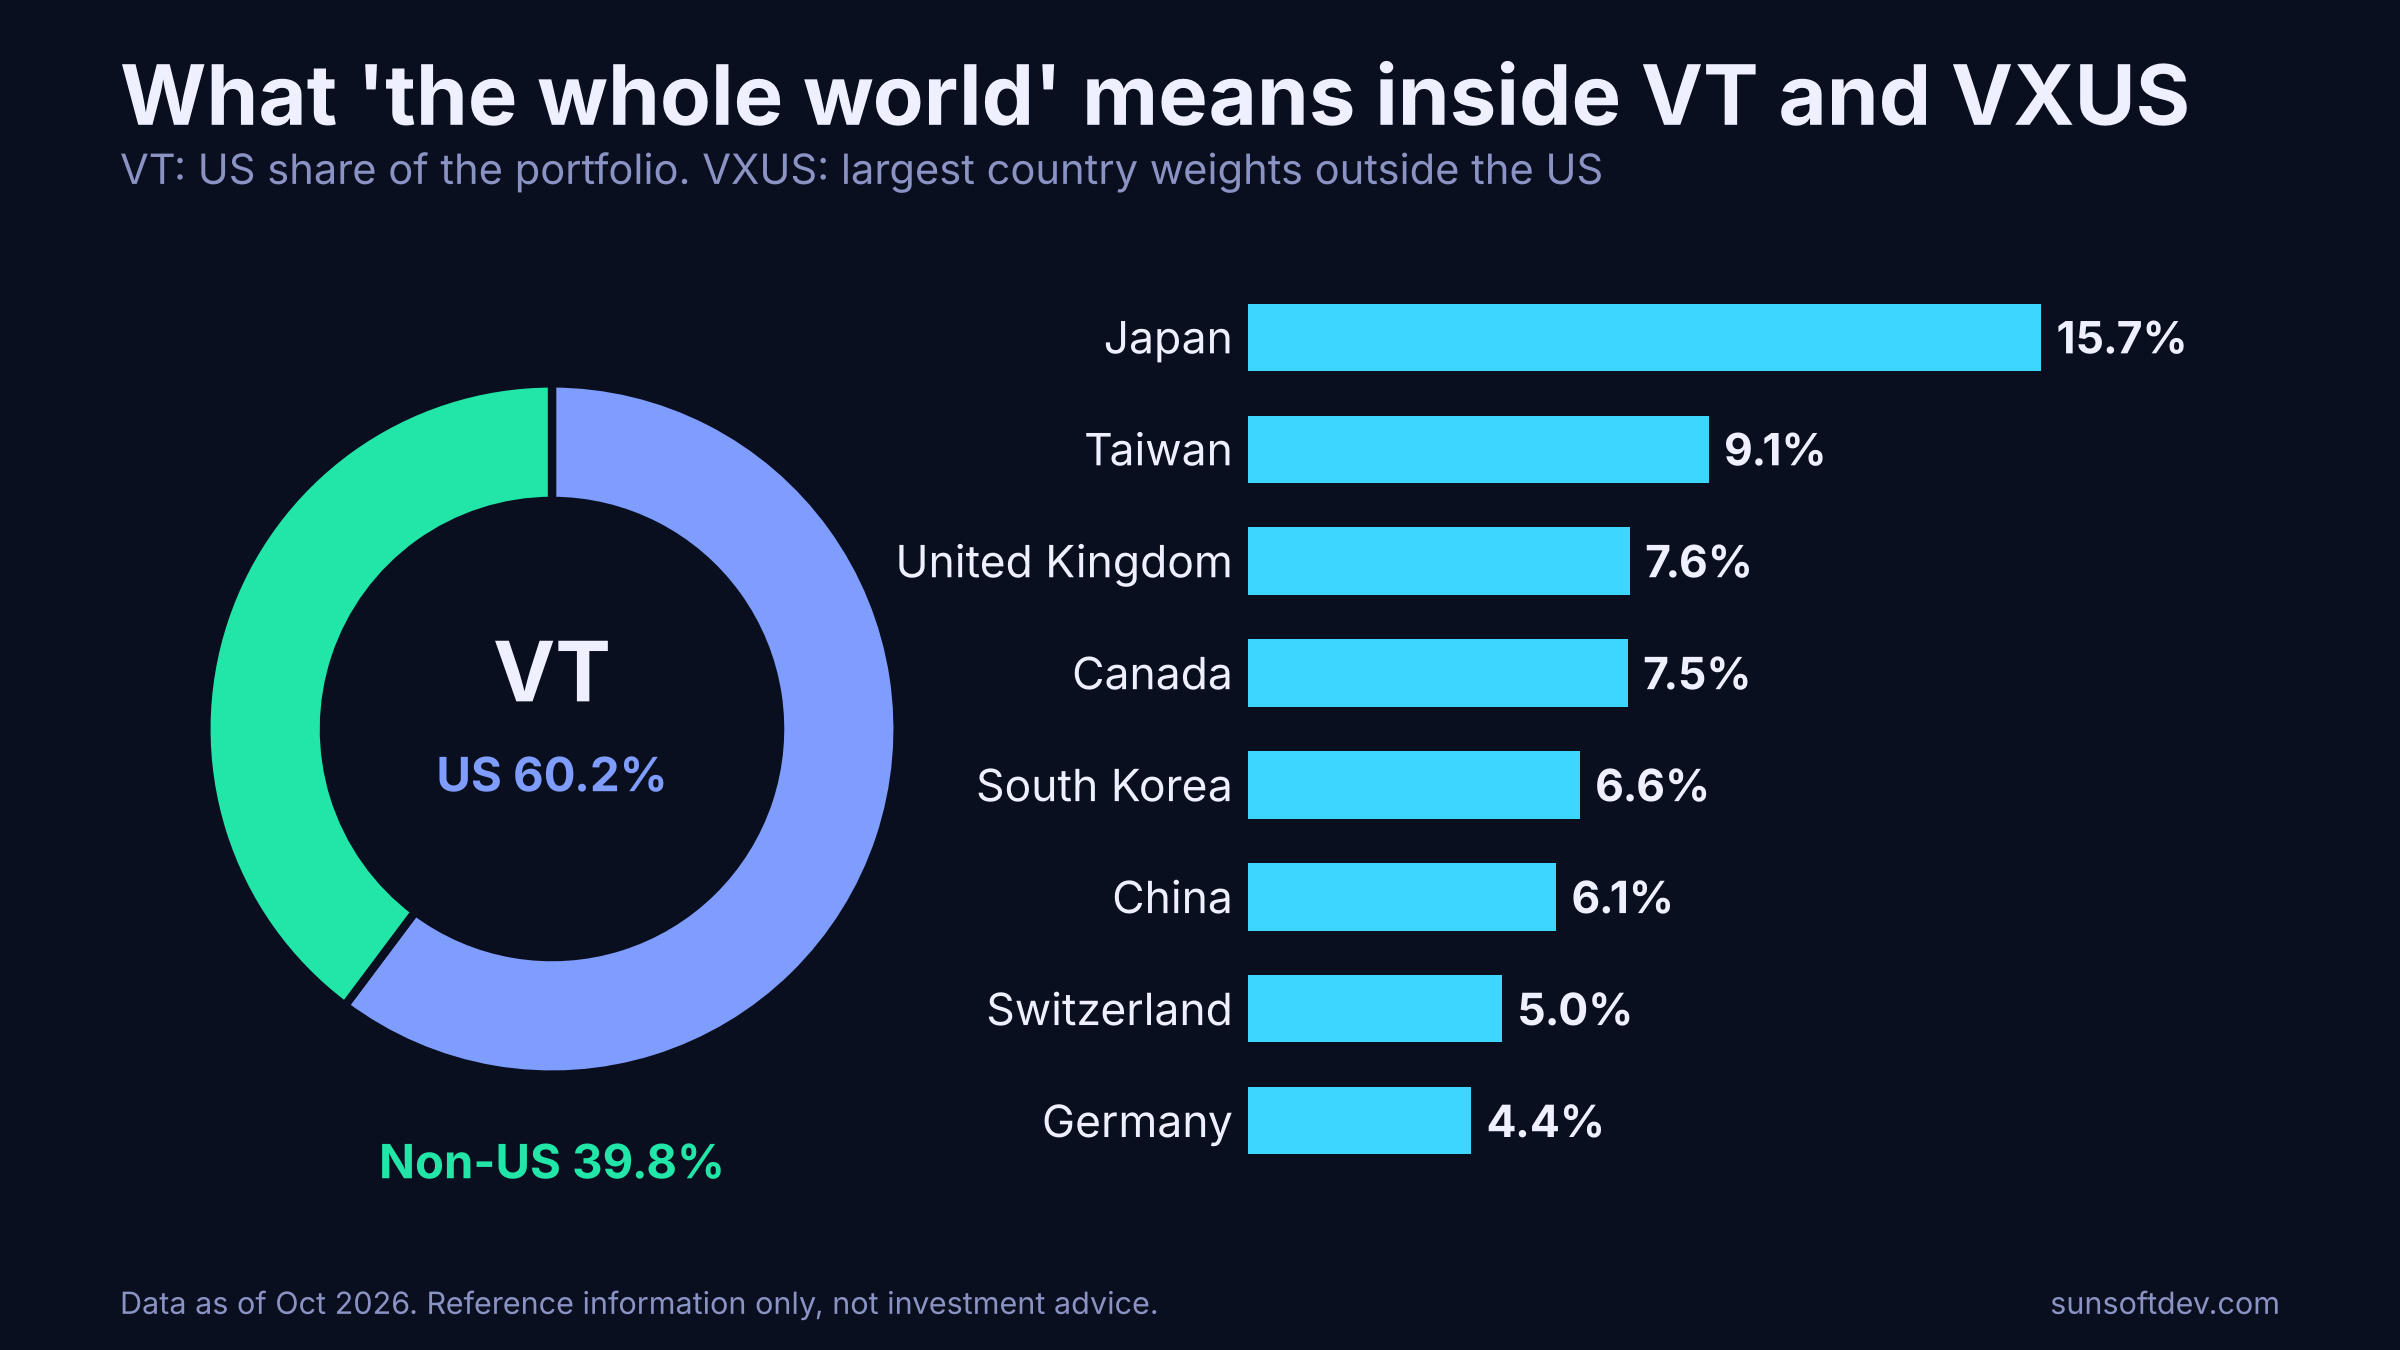
The US share is about 60.2%, with the rest spread across developed and emerging markets. VT is roughly a one-ticker version of the classic pairing of a US total-market fund (VTI) and an international fund (VXUS), though the index providers and small-cap treatment differ.
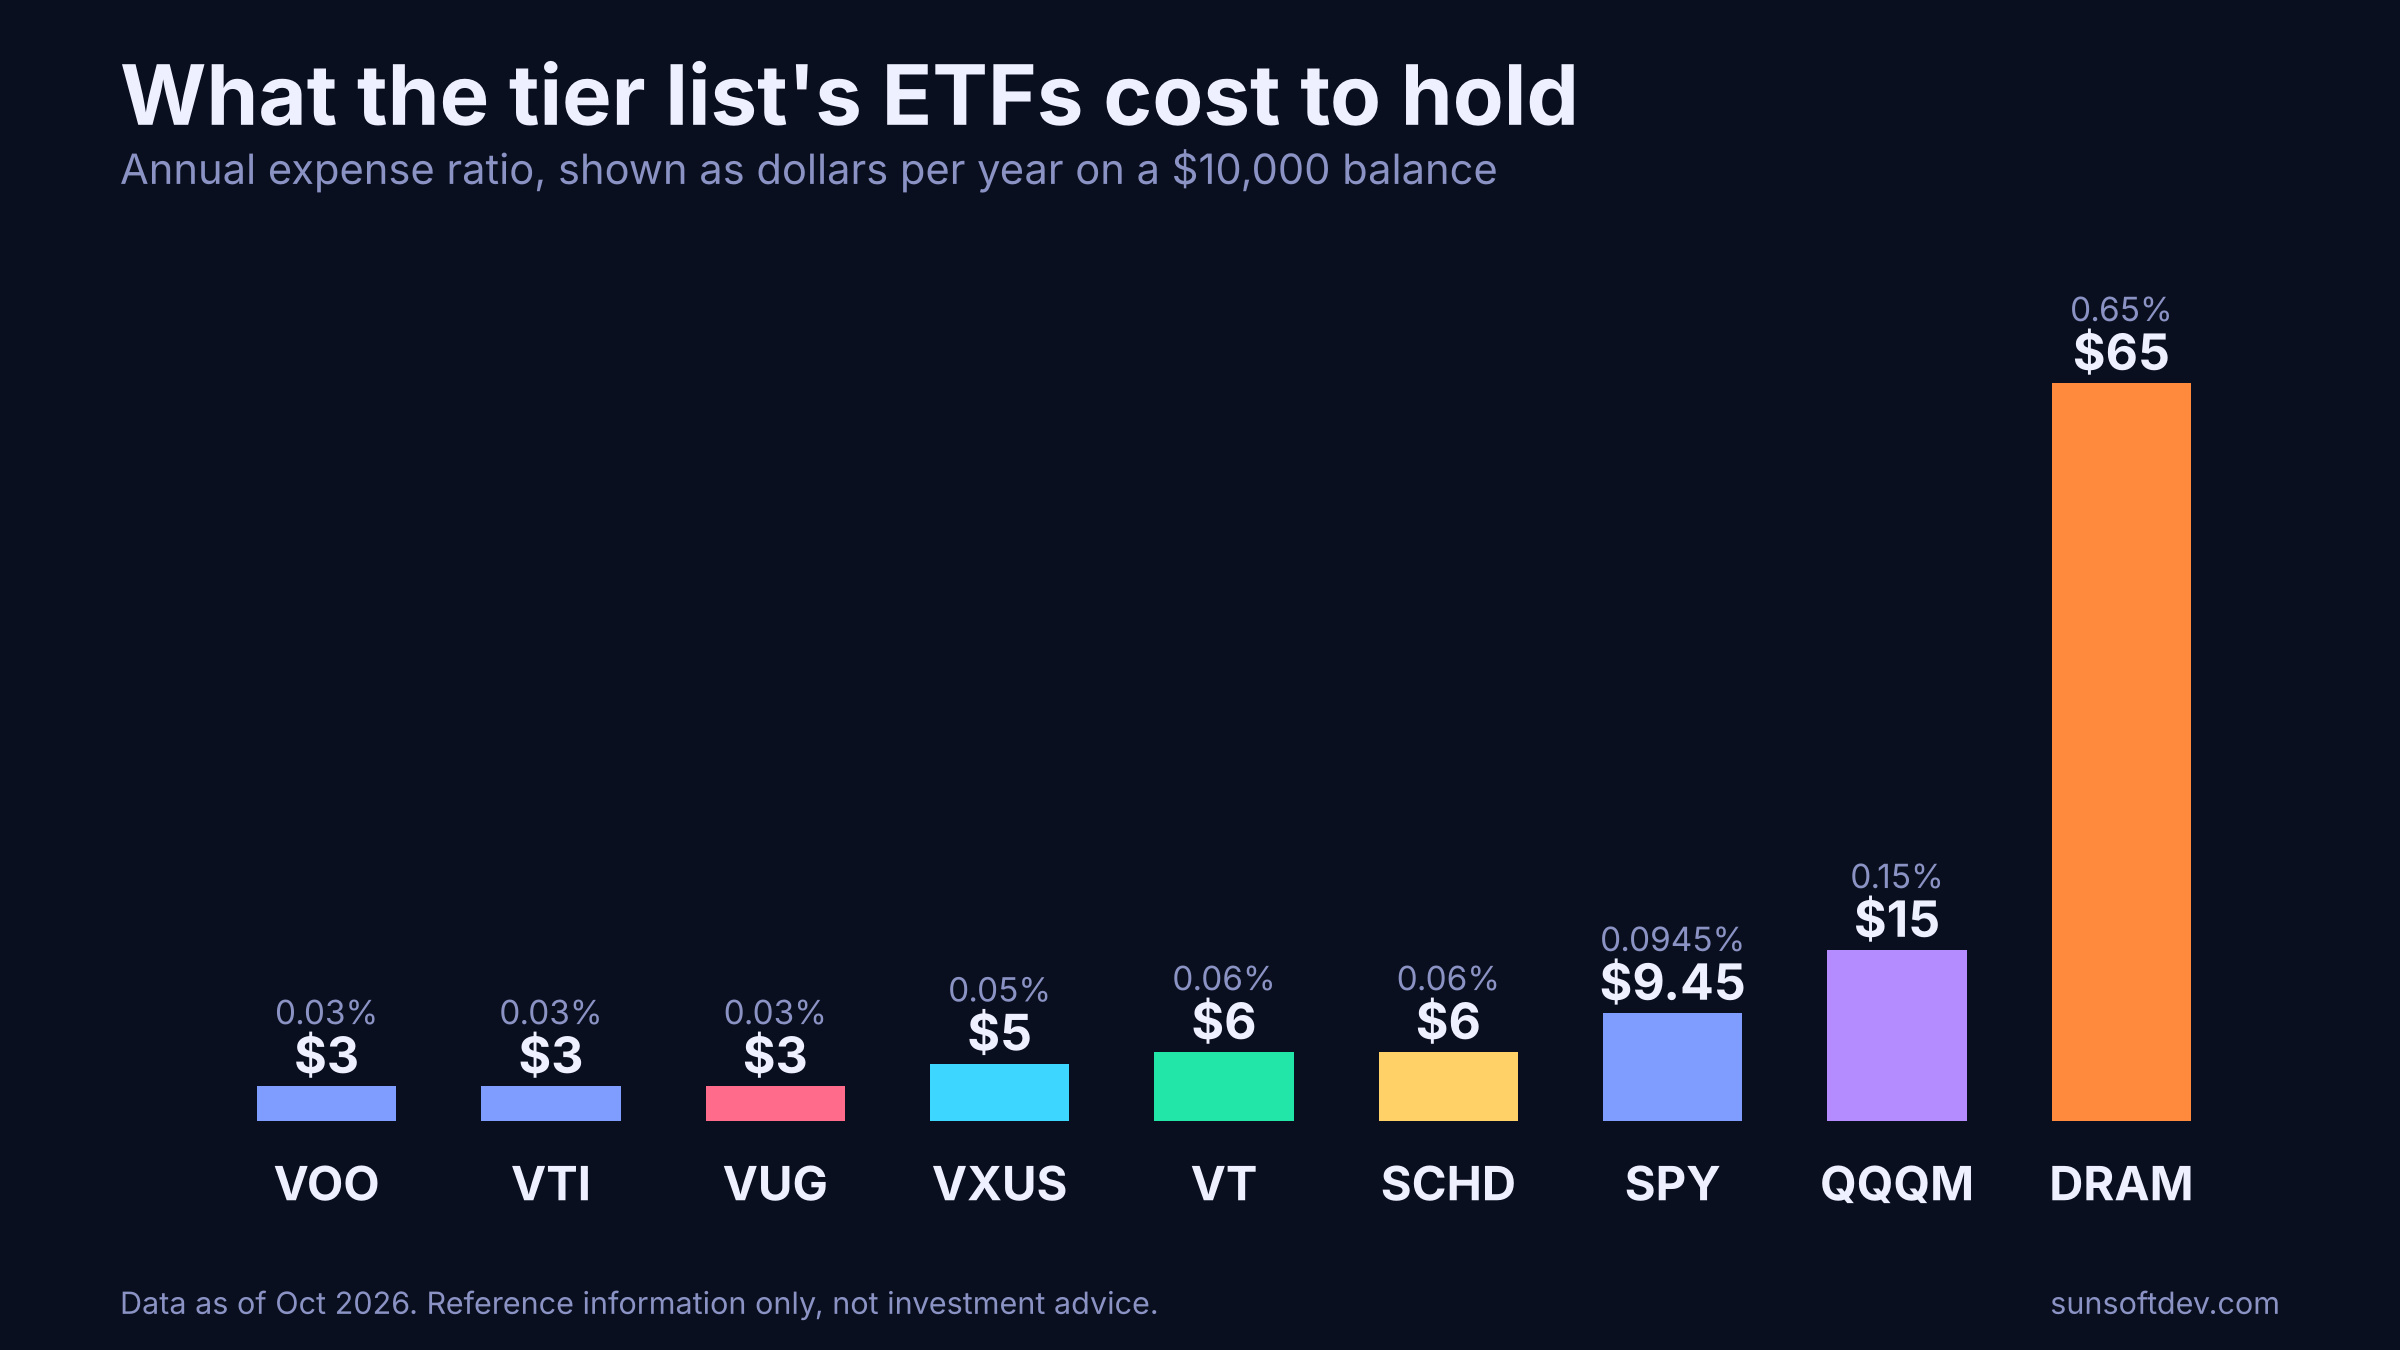
The trade-off is a fee of 0.06% against 0.03% for VOO or VTI. That is $3 more per year on $10,000. VT also owns more of the world than many investors expect, including Taiwan, South Korea and China. Whether that is a feature or a drag depends on your view, and nothing in the fund's structure promises it will outperform a US-only fund.
Tier 2, VOO, VTI and VXUS: three building blocks
VOO holds 518 stocks at 0.03%, with $1.05 trillion in assets. Its top ten, led by NVIDIA at 8.39%, Apple at 7.38% and Microsoft at 5.78%, make up 39.11% of the fund.
VTI casts a wider net: 3,527 stocks and a 34.67% top-10 weight, also at 0.03%. The two are close substitutes. VTI adds mid and small caps; VOO sticks to the S&P 500.
VXUS is the odd one out in this tier, because it holds no US stocks at all. It covers 8,999 non-US companies at 0.05%. Japan is the largest country at 15.7%, followed by Taiwan at 9.1% and the UK at 7.6%. TSMC (4.27%), Samsung Electronics (2.03%) and SK hynix (1.67%) lead its holdings.
Put VTI and VXUS together and you get a rough two-fund version of VT. That is one reason these three sit side by side in tier 2. They are less rivals than parts of the same toolkit.
One naming note: after Morningstar acquired CRSP, the CRSP indexes that Vanguard funds such as VTI follow are being renamed Morningstar indexes, with methodology unchanged. If you see "CRSP" in older material, it is the same family.
Tier 3, VUG: growth, concentrated
VUG holds 139 large US growth stocks for 0.03%. It is cheap, but it is the most concentrated fund on the board: its top ten are 63.11% of assets. NVIDIA (13.48%), Apple (12.50%) and Microsoft (9.74%) alone add up to about 35.7%.
By sector, about 74% sits in two technology-heavy groups, electronic technology (43.08%) and technology services (31.05%). The dividend yield is 0.39%. This is a style tilt, not a broad-market fund. When growth stocks lead, it can look brilliant; when they lag, there is little else in the portfolio to cushion it.
Tier 4, QQQM: the Nasdaq-100 at a lower price
QQQM tracks the same Nasdaq-100 index as the better-known QQQ, as a lower-fee sibling fund. It charges 0.15%, holds 106 stocks and has a 47.13% top-10 weight, with $107.3 billion in assets.
QQQ itself changed in late 2025. Invesco converted it from a unit investment trust into a standard open-end ETF effective December 22 and cut its fee from 0.20% to 0.18%. QQQM at 0.15% still costs less, at $15 versus $18 a year per $10,000.
Of the funds here, QQQM has the best five-year record in the data below. Its top ten also include more recent AI-cycle names than most: Micron is 4.40% and AMD is 3.78%.
Tier 5, SPY: same index as VOO, older wrapper
SPY and VOO both track the S&P 500. The difference is structure and price. SPY is a unit investment trust, a design that, bars it from reinvesting dividends, using derivatives to equitize cash or lending securities. It charges 0.0945% against VOO's 0.03%, a gap of 6.45 basis points, or $6.45 a year on $10,000.
SPY's advantage is trading, not holding. It is among the most heavily traded ETFs, which helps keep spreads tight for active traders. For someone buying and holding for years, that matters less than the fee. This is the clearest case on the board where two funds hold nearly the same stocks and the main reason to prefer one is cost.
Tier 8, SCHD: a different job
SCHD tracks the Dow Jones U.S. Dividend 100 Index. It holds 102 stocks, charges 0.06% and yields 3.04%, the highest on the board. A fund like this is not built to be the broadest core holding. One analysis describes it as a high-quality income sleeve rather than a fully diversified core, suited to investors who also hold a broad market fund.
Two things are worth knowing. First, SCHD rebuilds its portfolio each year, and the March 2026 reconstitution was unusually large: about 31% turnover versus a historical 8% to 15%, with 25 stocks added and 22 removed. Energy fell from 23.5% to 16.3% and utilities went from 16.2% to zero, while healthcare rose to 18.9%. Second, with a 41.55% top-10 weight on only 102 names, it is more concentrated than VT, VTI or VOO.
A lower tier here does not mean a bad fund. It means a fund that does a different job than the funds above it.
Tier 10, DRAM: a theme, not a core holding
The Roundhill Memory ETF (DRAM) launched on April 2, 2026. It charges 0.65%, holds nine stocks, and puts about 25% each in Micron, Samsung Electronics and SK hynix, with the remainder in Kioxia, SanDisk, Western Digital and Seagate. That is roughly three-quarters of the fund in three companies, and costs $65 a year per $10,000, roughly ten times VT's fee, for a narrow basket.
It is a single-theme fund. The tier list places it where a single-theme fund usually belongs next to broad index funds.
Why the funds look so alike
Look inside the US funds and the same names keep appearing. NVIDIA, Apple and Microsoft are in the top three of VOO, VTI, SPY, VUG and QQQM alike. Only the weights change.
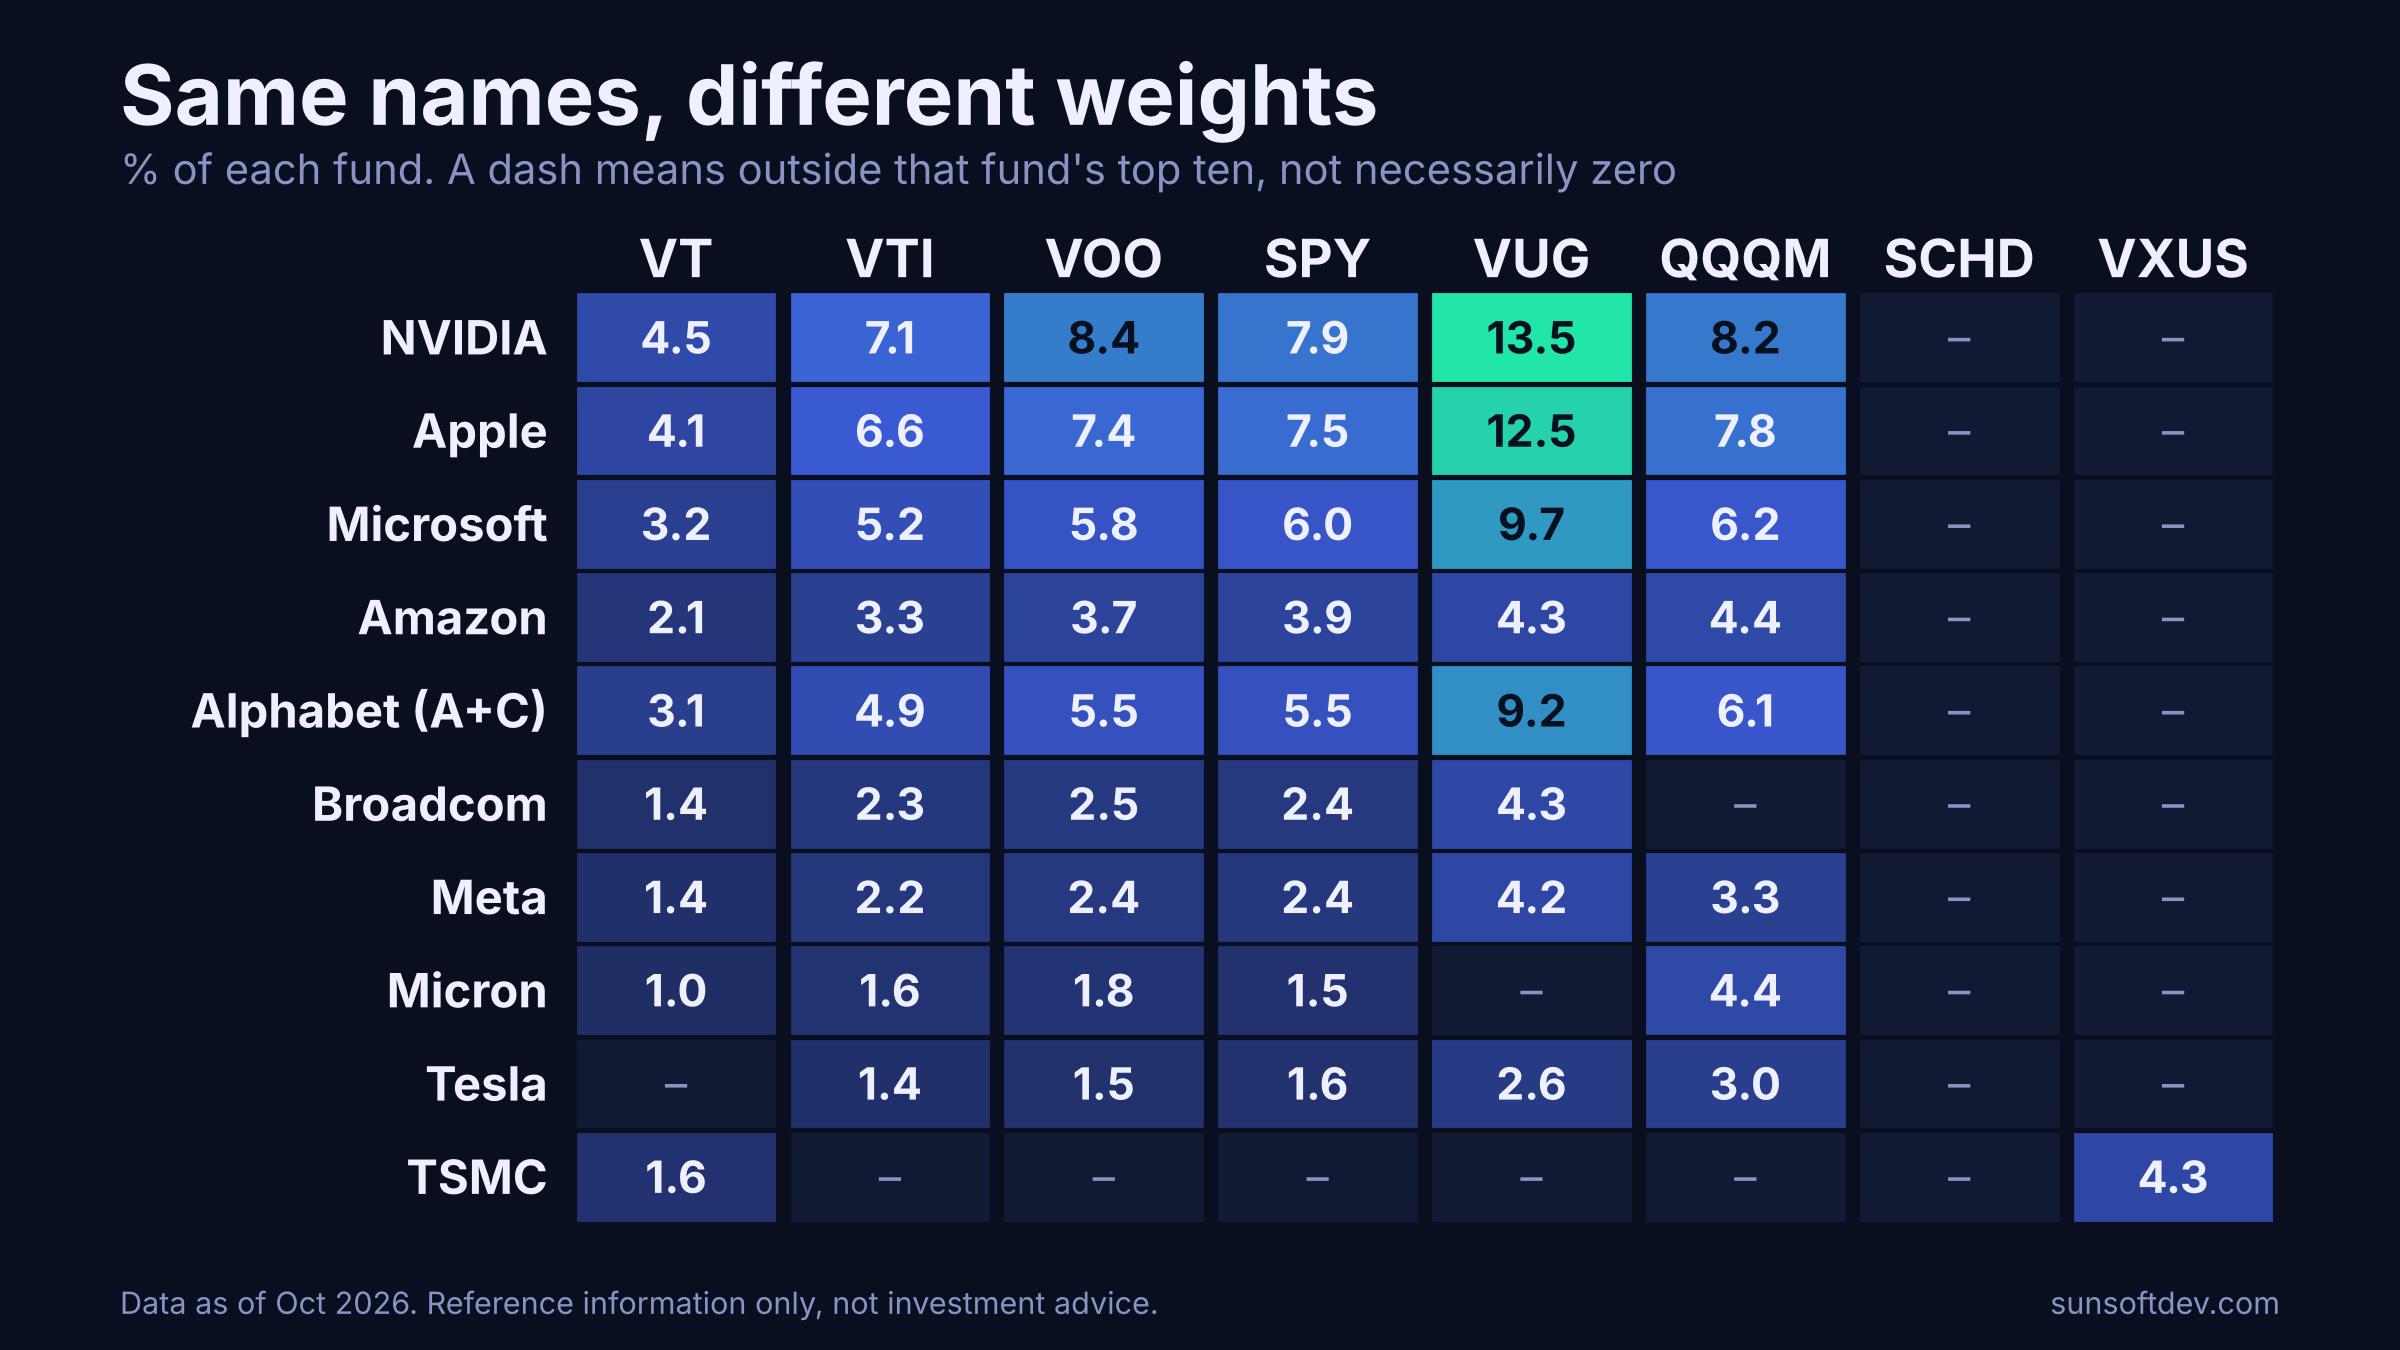
Three things stand out:
- Owning several US funds may be less diversified than it looks. A portfolio of VOO, VUG and QQQM stacks the same mega-cap stocks three times.
- Memory chips have reached the core funds. Micron is a top-10 holding in VT, VTI, VOO and SPY, and 4.40% of QQQM. TSMC, Samsung and SK hynix lead VXUS. A fund like DRAM concentrates what the broad funds already hold in small amounts.
- SCHD is the outlier. None of the mega-cap tech names appear in its top ten, which is why it behaves differently, for better or worse.
What the returns say, and what they do not
For the five funds with reliable same-date figures, here are annualized total returns over five years, as of October 19 and 20, 2026. SPY, VTI and SCHD are left out because no comparable same-date figure was available.
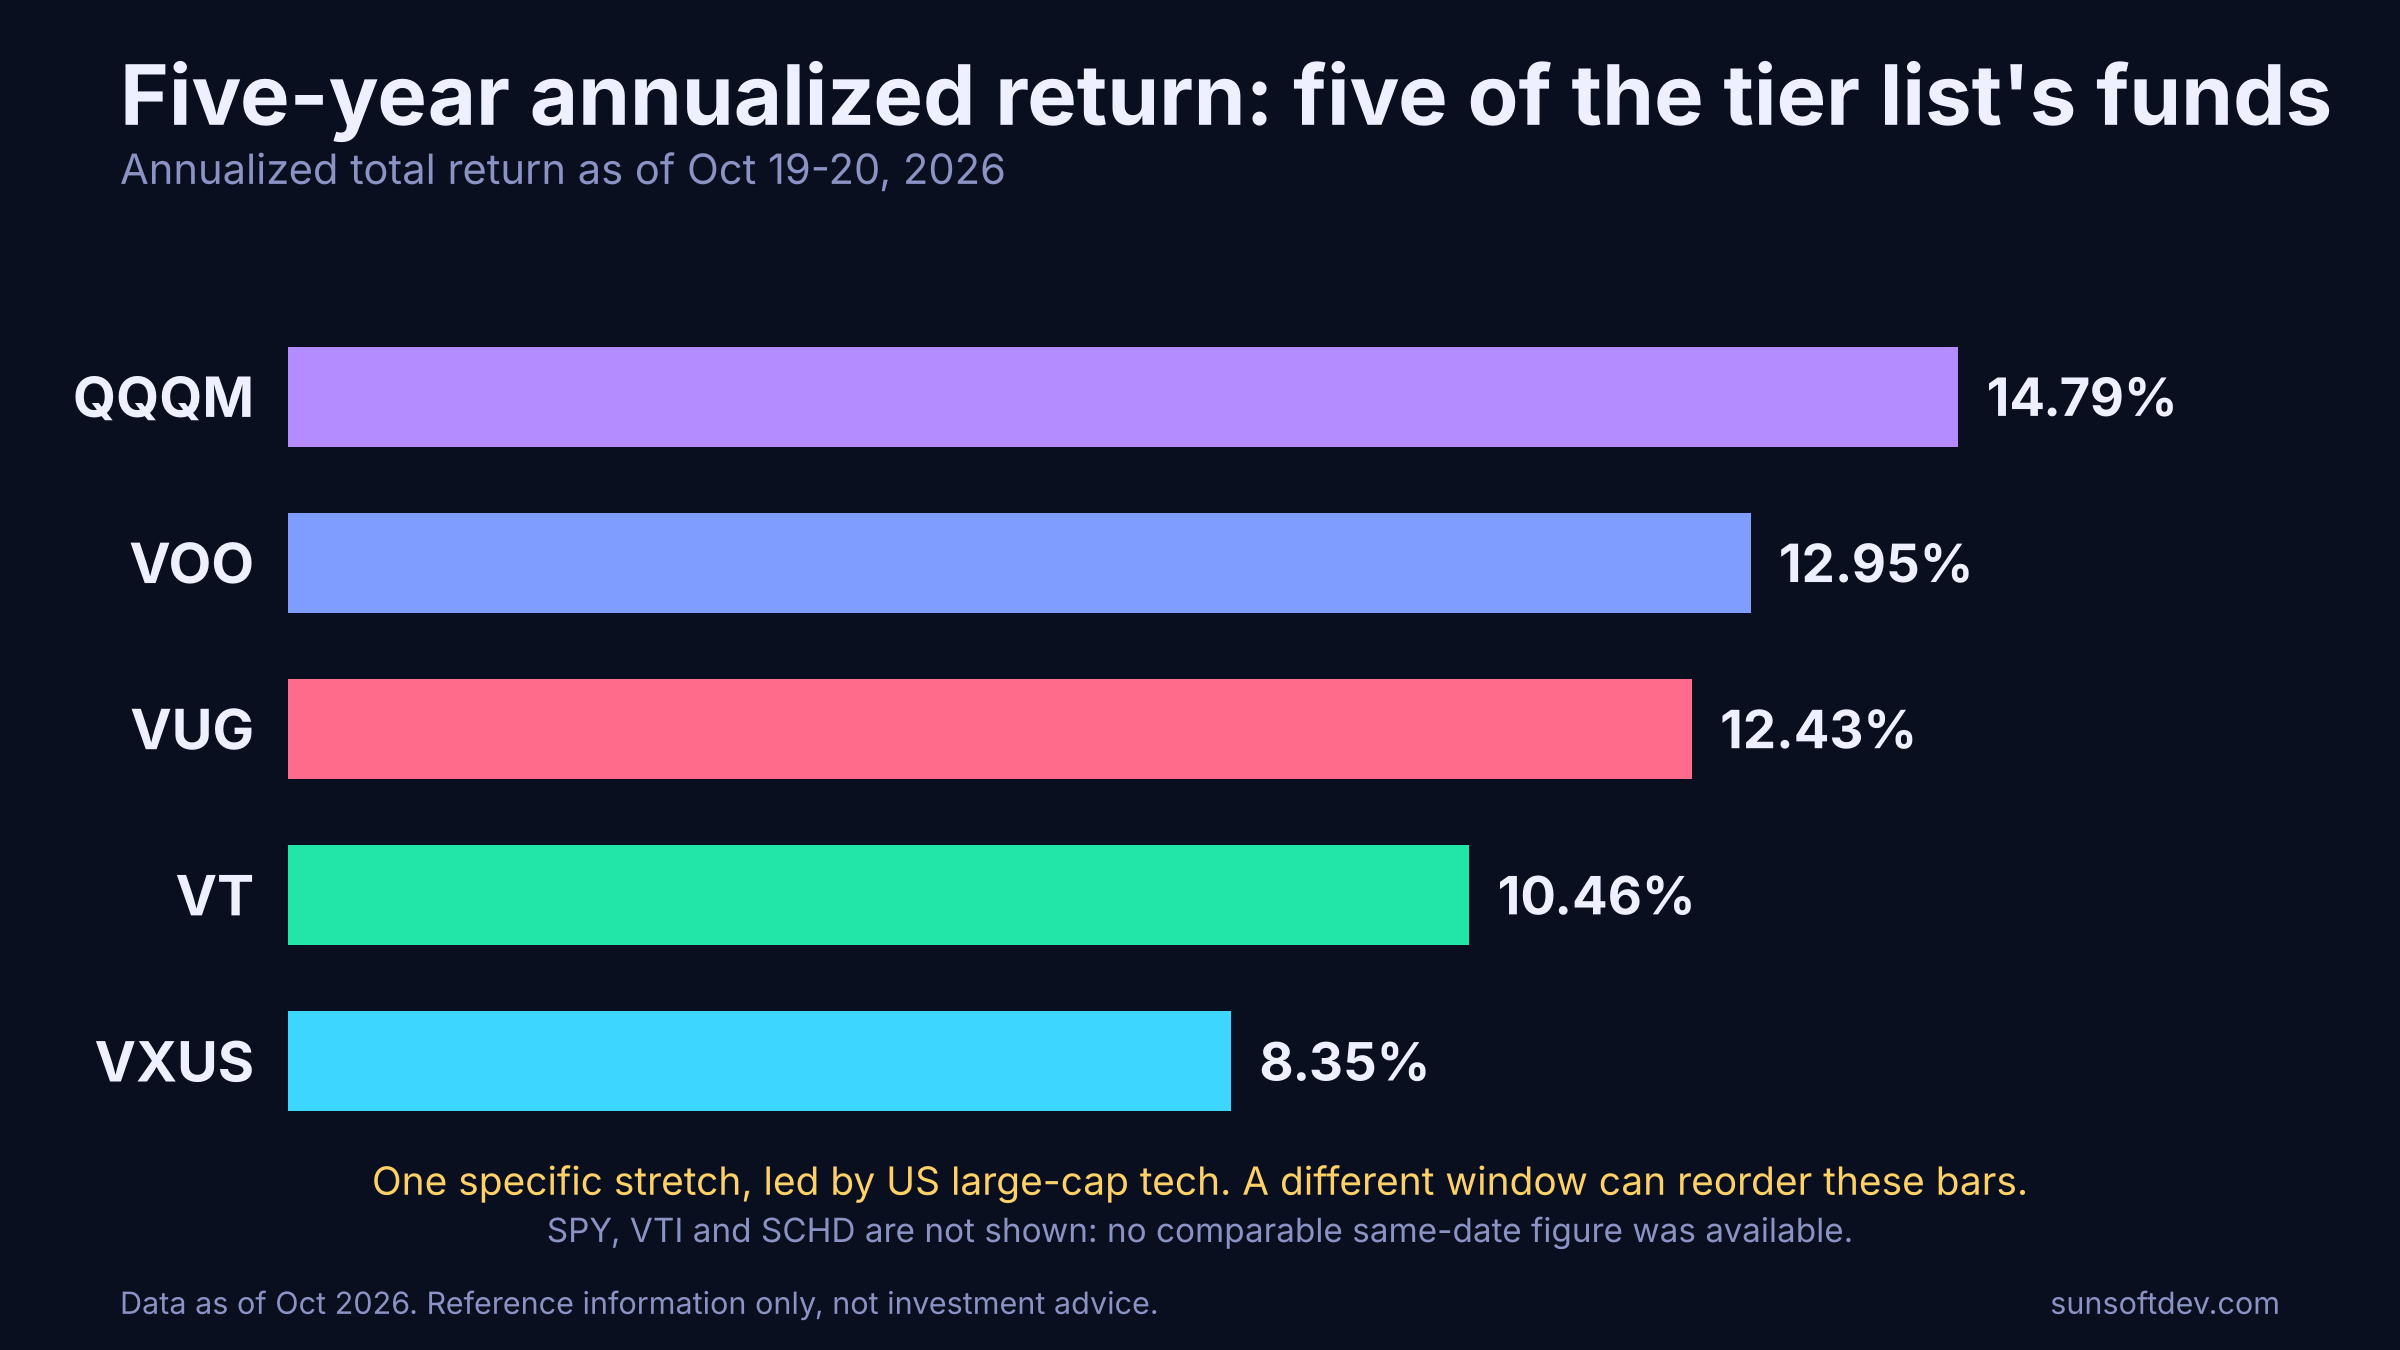
QQQM leads, VOO and VUG follow, and the two diversified funds, VT and VXUS, trail. That is what you would expect from a window in which US large-cap technology did well. It is not a prediction. In other periods, leadership has rotated, and funds that hold more of the world have led. Past performance does not predict future results.
This is also why the tier list's order and the return chart's order differ. One measures what happened over a specific stretch. The other, at least in part, appears to weigh breadth, cost and simplicity.
How investors use this kind of ranking
A tier list is useful as a conversation starter and unreliable as a decision tool. If you want to check a ranking against your own situation, these questions work better:
- What is the fund's job in my portfolio? Core, tilt, income or theme.
- What am I already holding? Overlap is the most common hidden risk.
- What does it cost, and is the structure sound? Fees and wrappers matter over decades.
- Could I hold it through a 30% or 50% fall? The best fund on paper fails if you sell at the bottom.
Risks to keep in view
Broad ETFs remove single-company risk, not market risk, and any of these funds can fall sharply. Funds concentrated in a few mega-cap stocks, like VUG and QQQM, can move more than the market in both directions. SCHD's annual rebuild can shift its sector mix and create tax events in taxable accounts. International funds add currency swings. Thematic funds like DRAM can lose value quickly if the theme cools. Fees, yields and holdings change, so recheck current figures before acting.
Bottom line
The tier list ranks a broad, cheap, global fund at the top and narrower funds below it, with a thematic fund last. The data supports the logic behind that order: VT has the most holdings and the lowest concentration, SPY's structure costs more than VOO's for the same index, and DRAM puts three-quarters of its money in three stocks. It does not support reading the ranking as a return forecast, because QQQM beat VT over five years. Use a tier list to start asking the right questions, then check the numbers yourself.
Disclaimer: This article is reference information only. It is not investment advice, a recommendation, or a solicitation to buy or sell any security. Investments can lose value, and past performance does not predict future results. Do your own research or consult a licensed adviser.
Related reading: ETF types explained and long-term stock ETFs compared: VOO, VTI and QQQ.