
$500,000 in the S&P 500: How Much Can You Spend Each Month? A 2008 Retirement Backtest
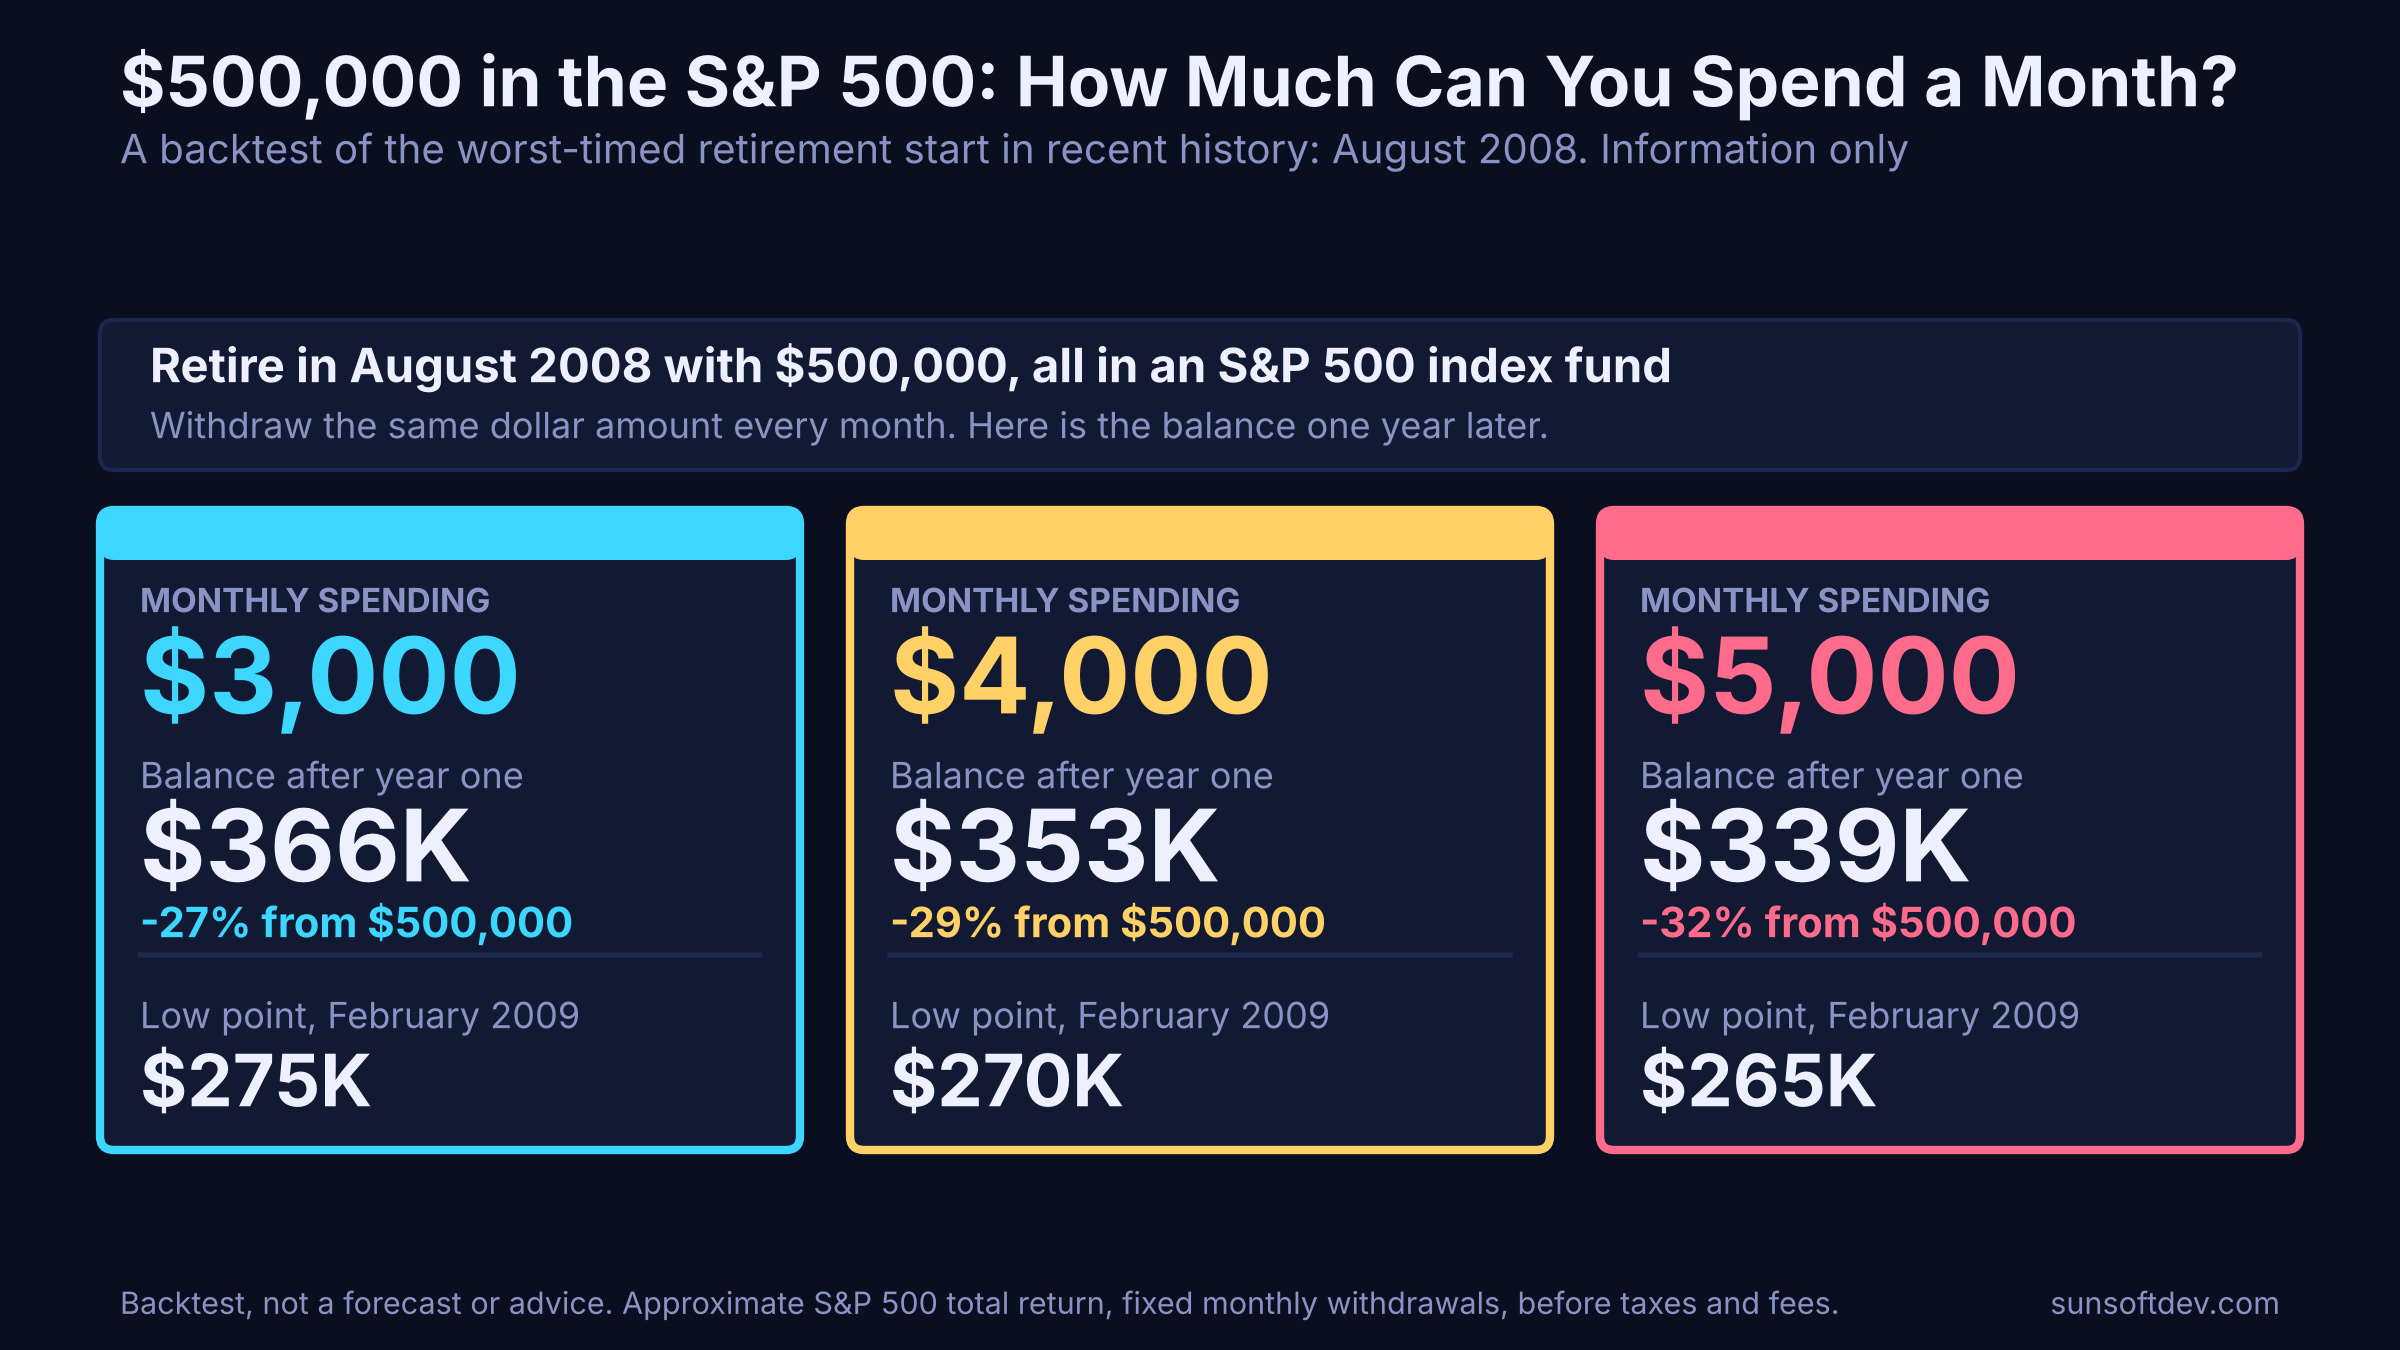
What if you retired in August 2008 with $500,000 in an S&P 500 index fund and spent $3,000, $4,000 or $5,000 a month? A backtest of the worst-timed start in recent history, with year-one balances and 16-year results. Reference information only.
Reference information only. This article is not investment advice, a recommendation, or a solicitation to buy or sell any security. It describes a hypothetical backtest. Past performance does not predict future results, and every investment can lose money. The figures are approximations built on simplified assumptions and are not a forecast or a plan for your own finances. Taxes, fees, inflation and your personal situation will change real outcomes. Consider speaking with a qualified financial professional before making retirement decisions.
A short finance video has been making the rounds with a simple, scary question. If you retired with a large lump sum in an S&P 500 fund right before the 2008 crash, and spent a fixed amount every month, how long would the money last? The video asks it in won. This is the dollar version: $500,000, August 2008, fixed monthly withdrawals, run on our own numbers.
August 2008 is a useful starting point because it is close to the worst case in recent memory. The financial crisis was weeks away, and the S&P 500 was about to lose roughly 43% by the end of February 2009 (measured month-end to month-end). If a retirement plan can survive that, it tells you something. If it cannot, that tells you something too.
The setup
- Starting balance: $500,000, all in an S&P 500 index fund, at the end of August 2008.
- Spending: the same dollar amount withdrawn at the end of every month, never raised for inflation.
- Scenarios: $2,000, $3,000, $4,000 and $5,000 a month, plus the "4% rule" starting amount of about $1,667 a month for reference. The $3,000, $4,000 and $5,000 cases are 7.2%, 9.6% and 12% of the starting balance per year, which is well above the commonly cited 4% starting rate.
- Dividends: assumed reinvested.
- Left out: taxes, fund fees and inflation adjustments. Taxes in particular depend on your country and account type, so we left them out rather than guess.
The method is simplified. We used month-end index levels through December 2010, then calendar-year total returns spread evenly across the months after that. That is good enough to show the shape of the result, but exact dollar figures, and especially the date a portfolio runs out, are approximate.
Year one: the damage is mostly the market
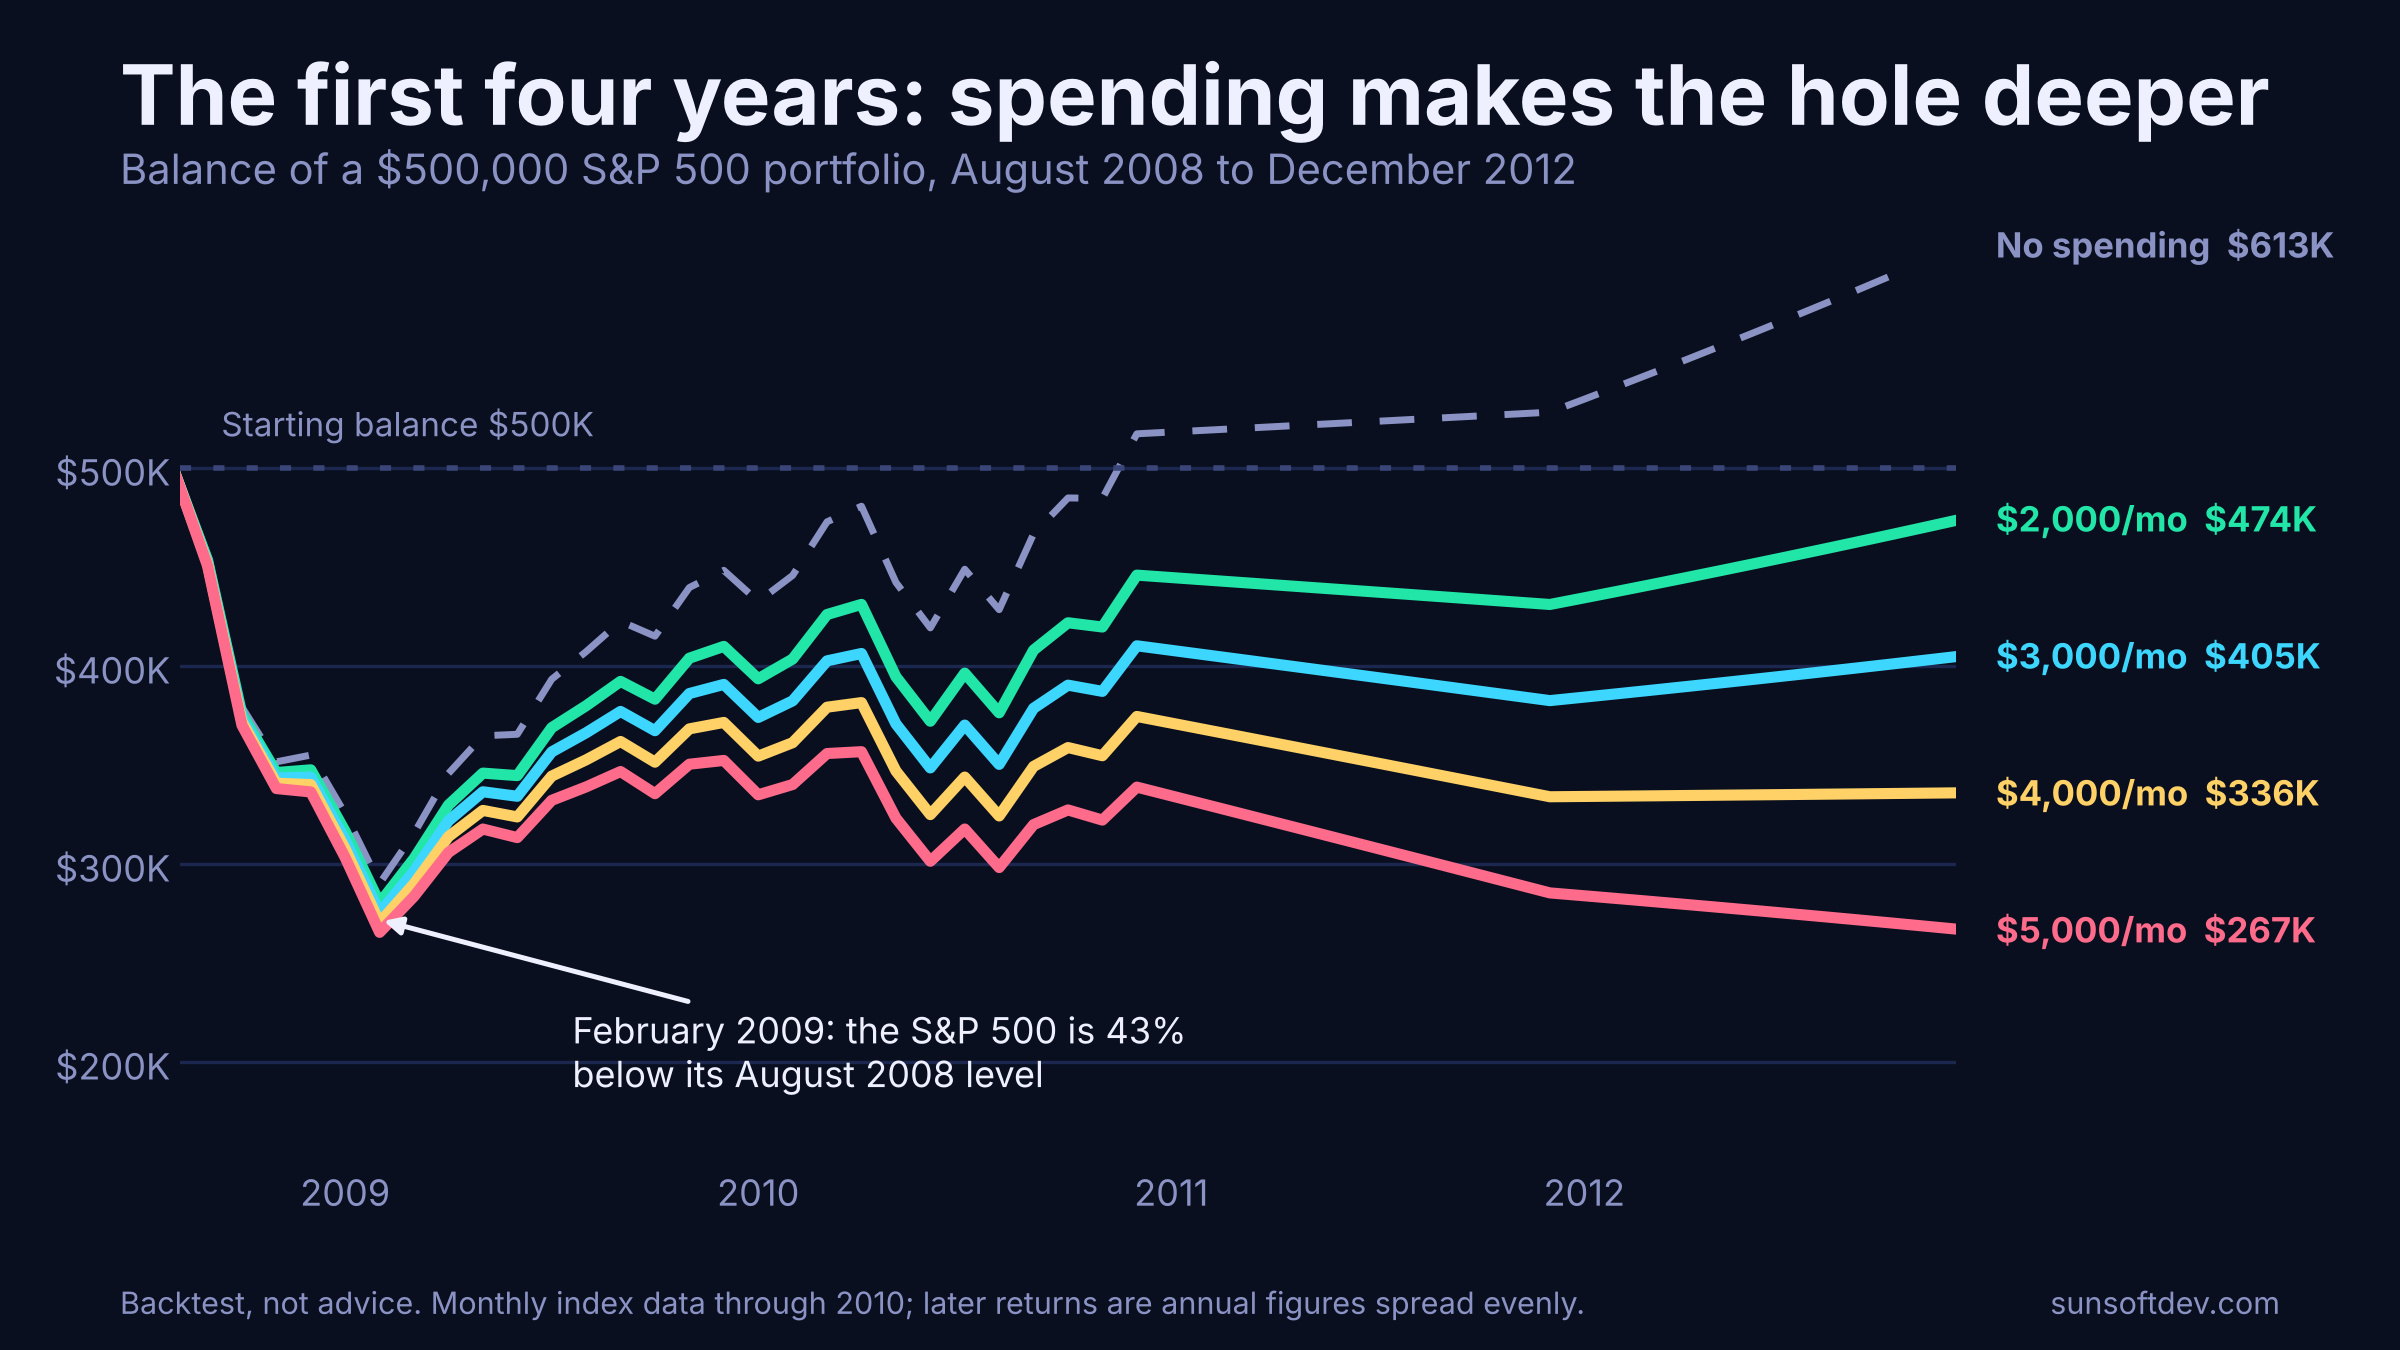
By February 2009, seven months in, every line had collapsed together. With no spending at all, the portfolio was down to about $290,000. The spending cases bottomed between roughly $265,000 and $282,000. In other words, the first big drop was mostly the market, and spending only added a small amount on top.
After a full year, in August 2009, the picture was this:
- $3,000 a month: about $366,000, down 27%.
- $4,000 a month: about $353,000, down 29%.
- $5,000 a month: about $339,000, down 32%.
The $500,000 with no spending had recovered to about $407,000 by then. The gap between the spenders and the non-spender is the real cost of withdrawing while prices are down: every dollar sold at the low is a dollar that cannot participate in the rebound.
Sixteen years later: two very different stories
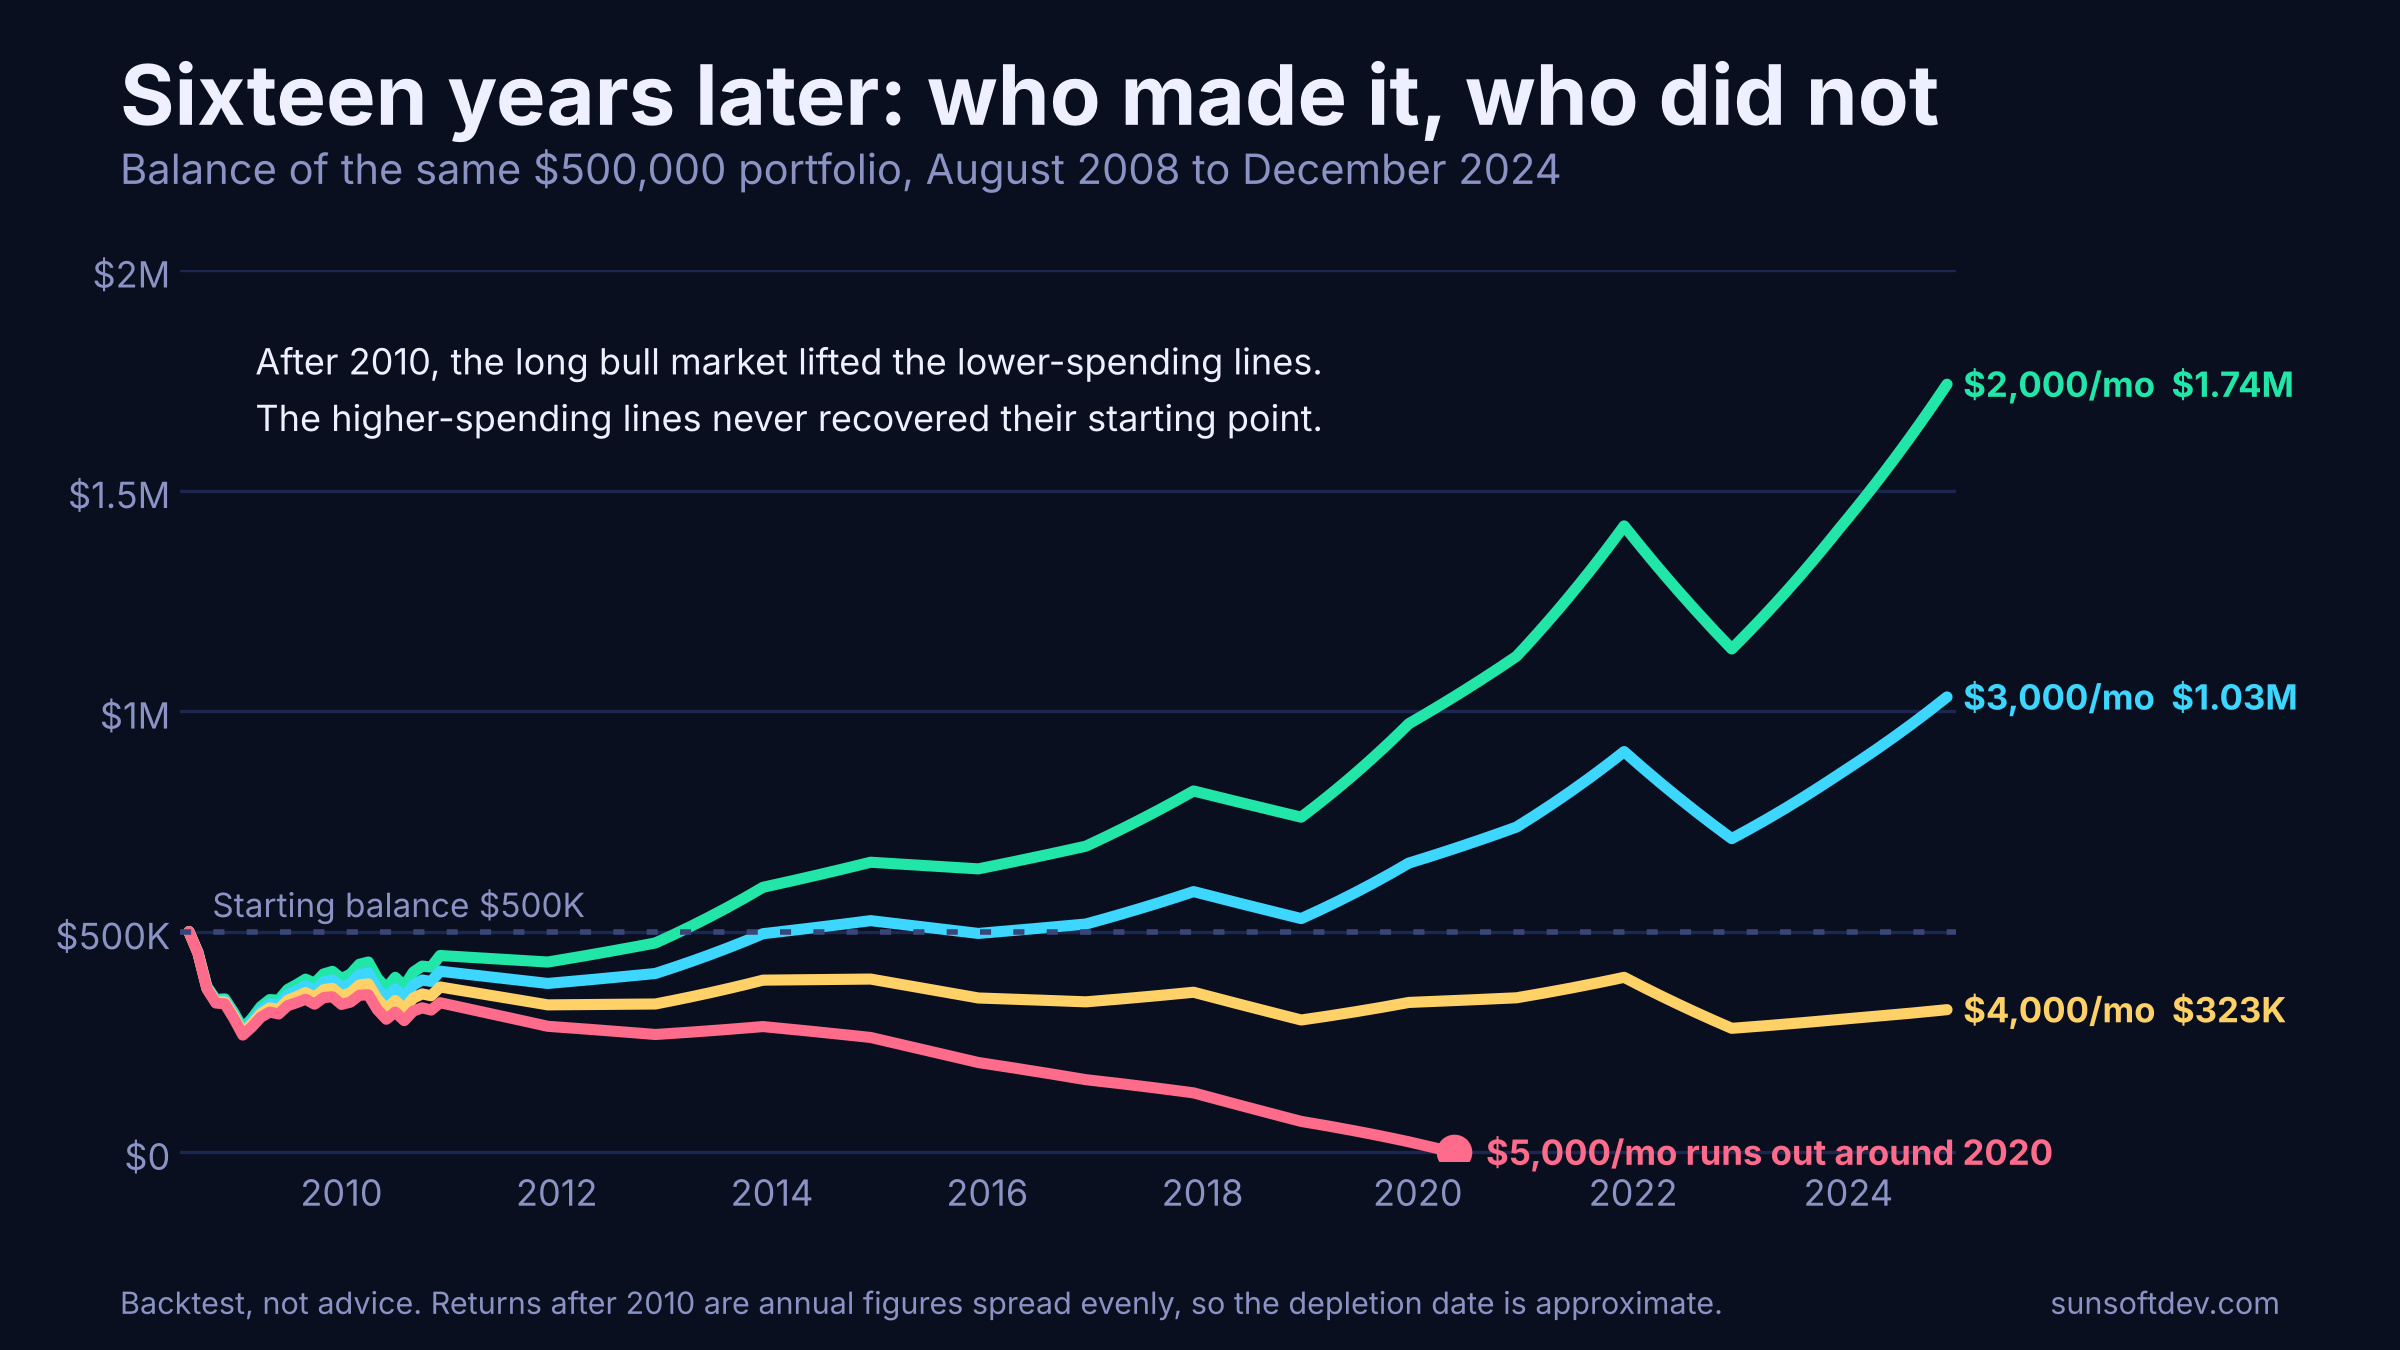
Here is where the scenarios split. The market recovered and then ran for a long stretch, but how much each retiree benefited depended on how much was left to recover with.
| Monthly spending | Share of start per year | Low (Feb 2009) | After 1 year | End of 2010 | End of 2018 | End of 2024 |
|---|---|---|---|---|---|---|
| About $1,667 (4% rule rate) | 4.0% | $282K | $384K | $458K | $836K | $1.98M |
| $2,000 | 4.8% | $280K | $380K | $446K | $760K | $1.74M |
| $3,000 | 7.2% | $275K | $366K | $410K | $530K | $1.03M |
| $4,000 | 9.6% | $270K | $353K | $375K | $300K | $323K |
| $5,000 | 12.0% | $265K | $339K | $339K | $70K | Ran out around 2020 |
Three points stand out.
The lower-spending cases did fine. At about $1,667 to $2,000 a month, the portfolio was back above its starting value by around 2013 and ended 2024 at more than three times the original $500,000.
The $4,000 case survived, but only just. It never regained its starting balance, hovered around $300,000 for years, and ended 2024 at about $323,000. Because the payments were never raised, the $4,000 check also bought roughly 30% less by 2024, since prices rose about 44% over the period. The $323,000 left over is worth roughly $225,000 in 2008 purchasing power.
The $5,000 case ran out. In our model it reached zero around 2020, about twelve years in, even though the market had been rising for most of that time. The money was gone before the long run could rescue it.
Where each spending level ended up
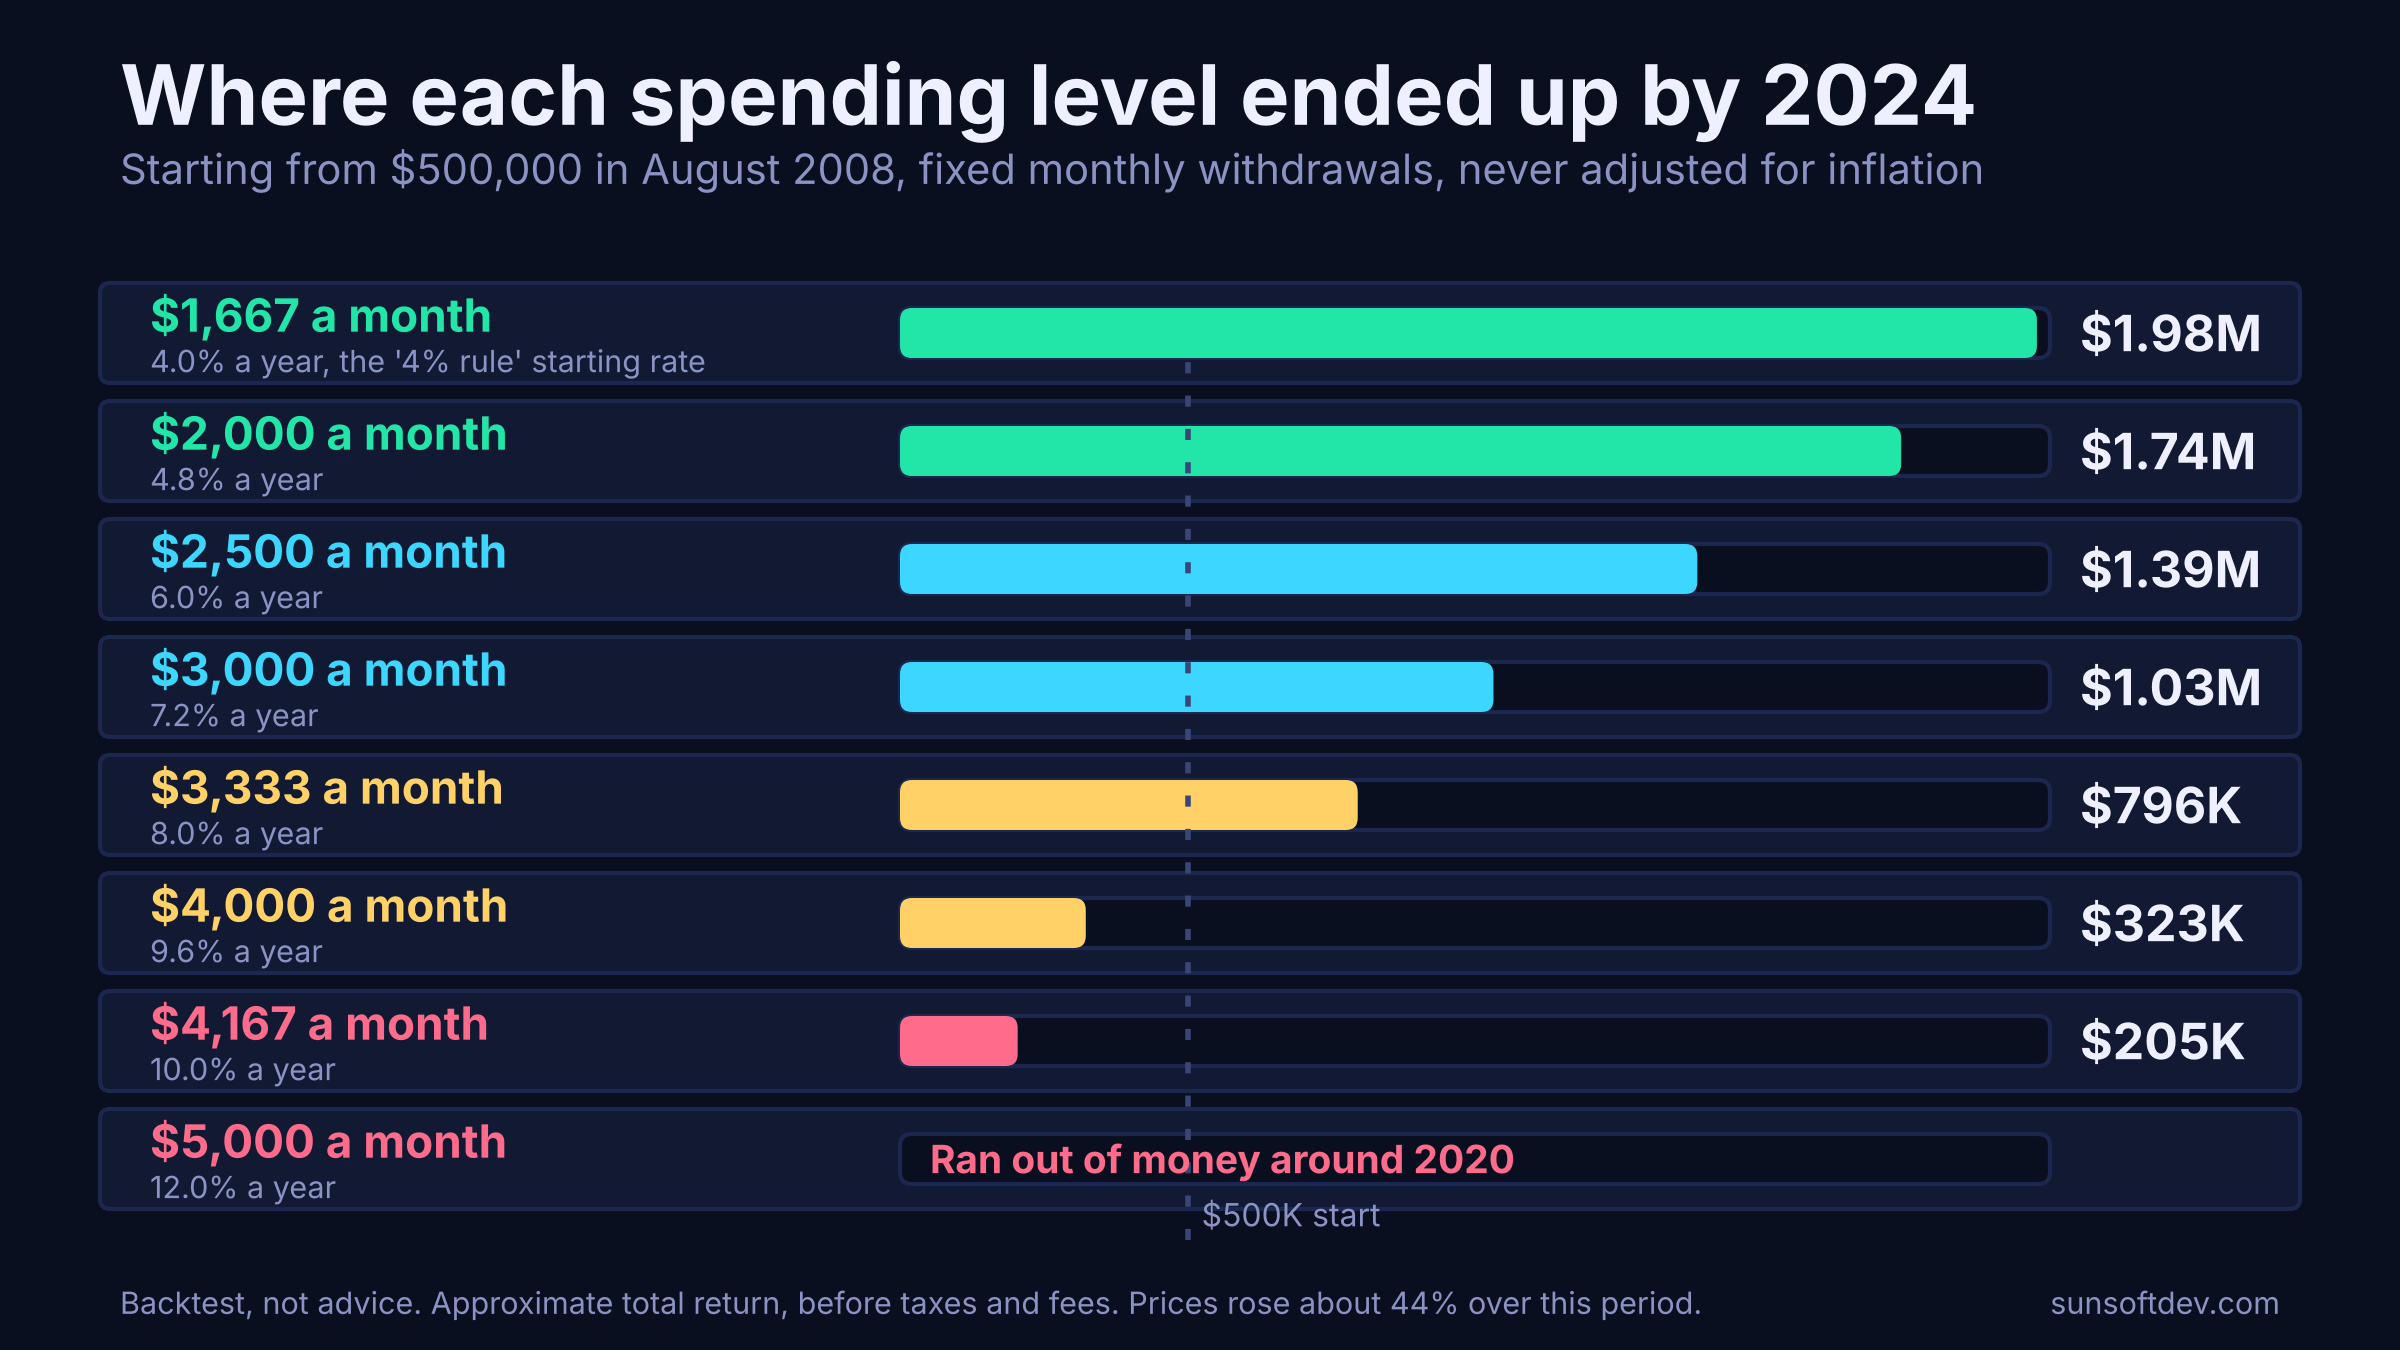
In hindsight, the highest fixed amount that would have lasted through December 2024 in this model was roughly $4,400 a month. It is tempting to read that as a safe number. It is not. It only describes what happened on this one path, including a very strong decade that nobody could count on in 2008.
Same spending, different start date
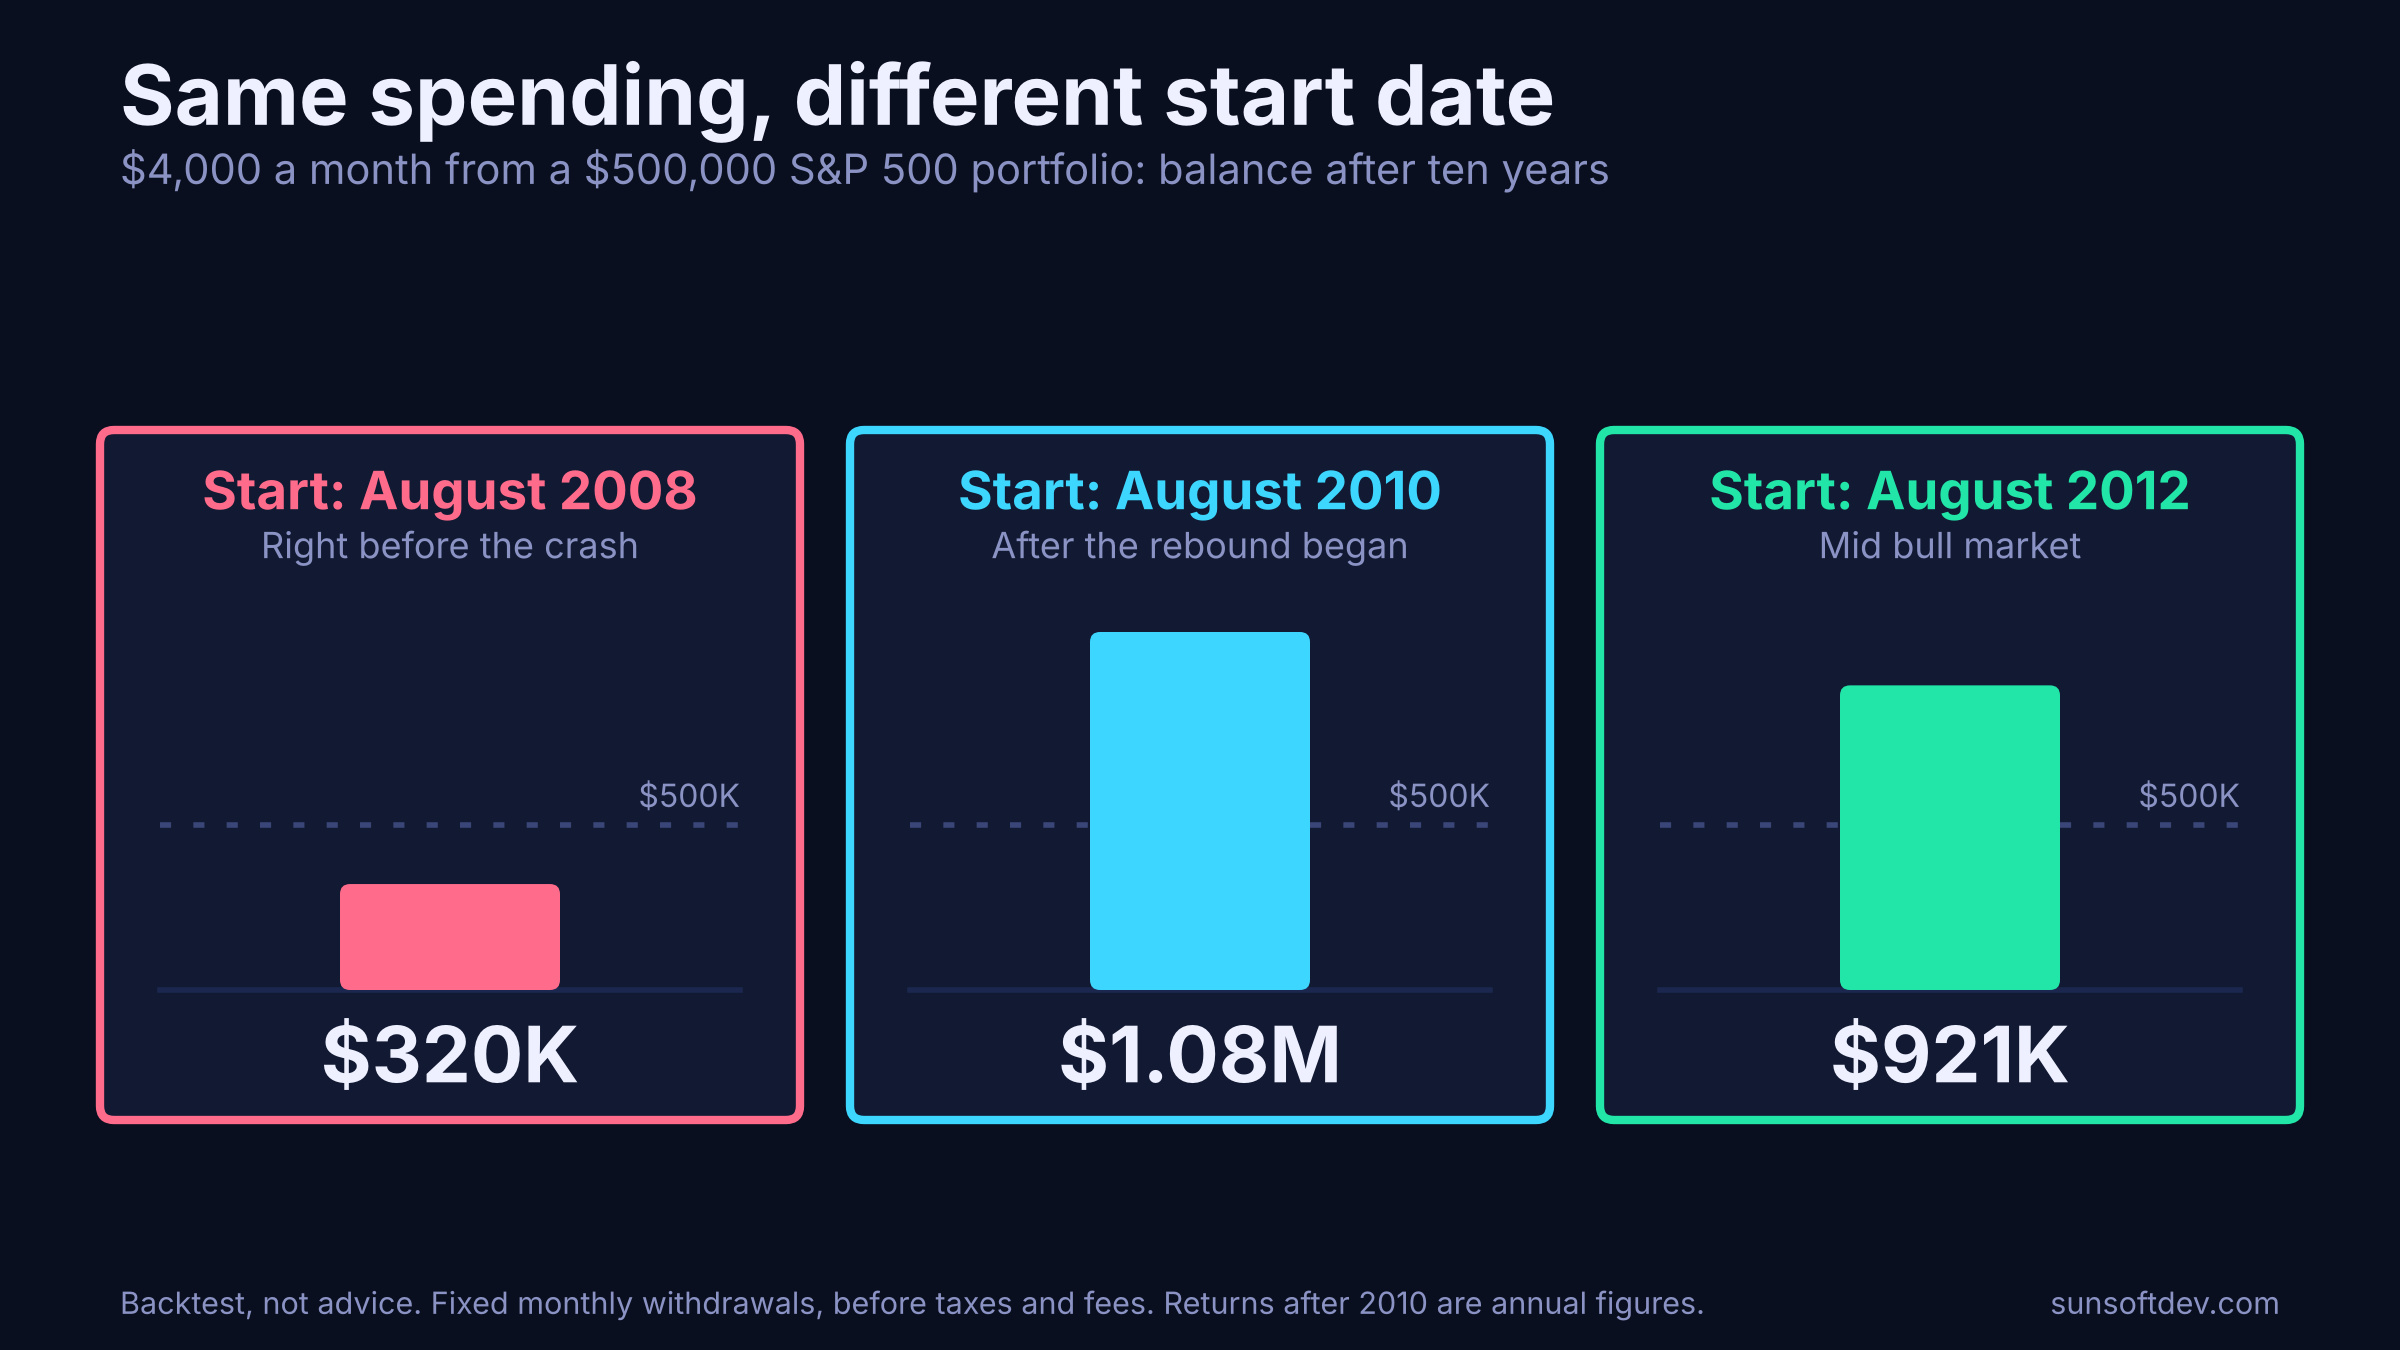
The most important lesson in this backtest is not about spending at all. It is about timing. Take the same $4,000 a month and the same $500,000, and change only the start date:
- Start in August 2008: about $320,000 after ten years.
- Start in August 2010: about $1.08 million after ten years.
- Start in August 2012: about $921,000 after ten years.
Same portfolio, same spending, three completely different outcomes. Planners call this sequence-of-returns risk: when the bad years happen matters as much as how bad they are. A big drop early in retirement hurts far more than the same drop later, because withdrawals lock in the losses while the balance is smallest. Someone who retired in 2008 and someone who retired in 2010 can follow the exact same plan and end up in different worlds.
What the 4% rule says, and what it does not
You may have heard of the "4% rule". It is a rule of thumb from retirement research suggesting that withdrawing about 4% of a starting portfolio in the first year, then raising the dollar amount each year with inflation, has historically lasted about 30 years for portfolios mixing stocks and bonds. On $500,000, that starting amount is $20,000 a year, or about $1,667 a month.
A few cautions are worth keeping in mind. It is a historical guide, not a guarantee. It was built around diversified portfolios and a roughly 30-year horizon, not necessarily a single stock index. And many people adjust their spending over time instead of following any fixed number. In our backtest, the 4% starting rate ended 2024 near $2 million, but it also depended on a long bull market, and a different path could have looked very different.
What this does and does not tell you
This is a single historical path, so it should be read as an illustration, not a prediction. A few things it does not capture:
- Real portfolios usually hold more than one asset. Bonds, cash and other holdings change how deep the drops are.
- Many retirees have other income, such as Social Security, a pension or part-time work, which can reduce how much they withdraw from a portfolio.
- Spending is rarely perfectly fixed. People often cut back after a bad year and spend more after a good one.
- Taxes, fees and inflation all reduce real results. Our model ignores all three.
- The future will not repeat 2008 to 2024. It could be better or worse.
Questions people often bring to a professional
- How much of my spending is flexible, and how much is not?
- What would a bad first five years do to my plan, and what would I change if it happened?
- How should my money be split between stocks and safer holdings?
- How do taxes work on the accounts I would withdraw from?
- How does my other income change what I need from this portfolio?
The bottom line
A $500,000 portfolio that supports $2,000 a month looks very different from one asked to support $5,000, and a bad start can matter more than a good average. In this backtest the S&P 500 recovered fully, yet a retiree spending 12% of the starting balance a year still ran out of money, and one spending 9.6% a year barely held on. The takeaway is not a magic number. It is that withdrawal rate, flexibility and timing all matter, and that a plan is easier to live with when it can handle a bad first few years.
Resources
Reference information only. This article is not investment, tax or legal advice and is not a solicitation to buy or sell any security. The backtest uses simplified, approximate assumptions and is not a forecast. Past performance does not guarantee future results.